Welcome to the wonderful world of Web Performance
Unlock the full potential of your website with sitespeed.io - the ultimate tool for monitoring and enhancing web performance. Say goodbye to the complexity and high costs of measuring performance. With our easy-to-use Open Source tools, you’ll have complete control over your metrics and own your own data. Welcome to the world of exceptional web performance with Sitespeed.io.
Docker
Use our Docker container to get an environment with Firefox, Chrome, Edge, XVFB and sitespeed.io up and running as fast as you can download them. They work extremely well together with Graphite/InfluxDB and Grafana that you can use to monitor your web site.
docker run --rm -v "$(pwd):/sitespeed.io" sitespeedio/sitespeed.io:39.4.2 https://www.sitespeed.io/
If you want to test a user scenario/journey read how to run test scripts.
If you are new to the project you should watch the tutorial “Getting started with Sitespeed.io using Docker”.
npm
Install sitespeed.io globally:
npm install -g sitespeed.io
Make sure you have the browser you want to use for testing installed (Firefox/Chrome/Edge/Safari) and then run:
sitespeed.io https://www.sitespeed.io/ -b chrome
Follow our connectivity guide to emulate real users connectivity.
Want to run the test on your Android phone?
sitespeed.io https://www.sitespeed.io/ -b chrome --android
Deploying your own version of sitespeed.io online
Today, I have some exciting news to share! I have built a frontend for sitespeed.io to add another way to run your performance tests. Read the blog post to find out more.
Get the latest versions
- sitespeed.io 39.4.2 [Docker/npm/changelog/RSS]
- Browsertime 26.3.2 [Docker/npm/changelog/RSS]
- Onlinetest 2.0.0 [changelog/RSS]
- Coach (core) 8.1.3 [Docker/npm/changelog/RSS]
- PageXray 4.4.4 [npm/changelog/RSS]
- Compare 1.0.0 [npm/changelog/RSS]
- Humble 1.0.0 [changelog/RSS]
- Throttle 5.0.1 [npm/changelog/RSS]
- Chrome-HAR 1.0.1 [npm/changelog/RSS]
What tool should I use?
Get a comprehensive performance measurement with sitespeed.io - the ultimate tool for monitoring and enhancing web performance. It’s the main tool that uses all the other sitespeed.io tools, supports testing multiple pages and reporting metrics to time series databases (Graphite and InfluxDB) for monitoring your website.
If you’re looking to focus on timing metrics only, then Browsertime is the perfect choice for you. But for a complete performance measurement, use sitespeed.io.
If you’re a developer of performance tools, then take advantage of the other tools that Sitespeed.io offers such as The coach, Browsertime, Chrome-HAR, PageXray and Throttle. Each tool can help you in different ways, depending on what you’re building.
Google Web Vitals
Experience unparalleled performance tracking and monitoring with our advanced Google Web Vitals monitoring tools. From First Contentful Paint to Largest Contentful Paint, Cumulative Layout Shift, and Total Blocking Time/First Input Delay, we’ve got you covered. Discover the most efficient way to track and monitor all your key performance metrics. Visit our Google Web Vitals documentation now to learn more.
Monitor your site
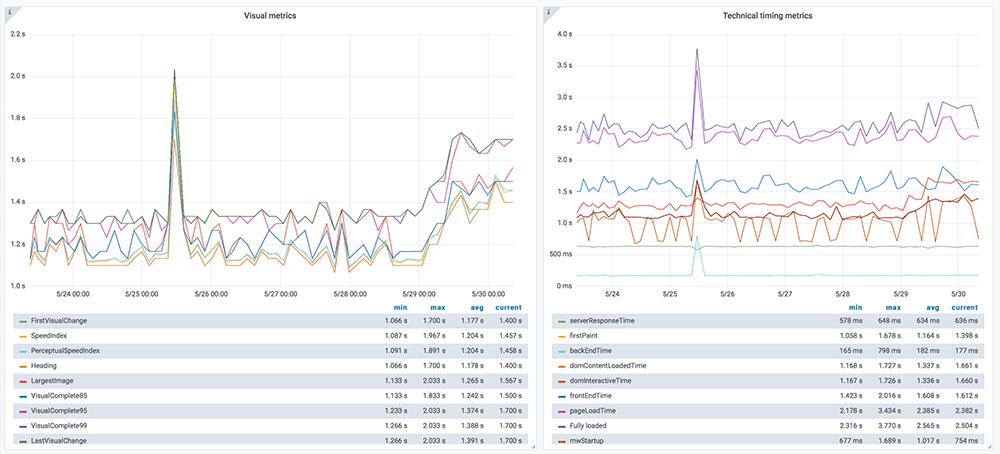
Using sitespeed.io together with Grafana and Graphite enables you to monitor the performance of your web site. We have a prepared docker-compose file for your setup and some ready made generic Grafana dashboards that will make it easy for you to get it up and running. You can get it up and running in almost 5 minutes!
We have a version of the dashboard at dashboard.sitespeed.io where you can have look and try it out.
We’ve been using the dashboards for years and years and it works really good. Read the documentation on how to set it up and get going.
We believe in privacy
At sitespeed.io, we understand the importance of privacy and take it extremely seriously. That’s why our documentation site, dashboard, and compare tool are completely free of any tracking software, including Google Analytics or any other similar programs. None of our tools will send any data back to us, giving you complete control over your information.
But we also know that your browser can be a weak point. Chrome and Firefox have been known to send data back to their servers. We’re always working to find ways to prevent this, and we welcome any contributions or suggestions from our users to improve your privacy when using our tools.
We take pride in our commitment to protecting your privacy and ensuring that you have complete control over your data. To learn more about our privacy practices, please read more.
What does it cost?
Sitespeed.io is freely available as Open Source software, with no hidden costs. However, running an instance of the tool does come with some expenses.
To keep costs low, we recommend using cloud/server hosting services such as Hetzner, and storing data on S3. With one instance, you can run a large number of tests per month, with an estimated cost of around $500 per year.
To get a more detailed understanding of the costs involved, please refer to our cost breakdown information.
Thank you!
We are incredibly grateful for the Open Source tools that form the foundation of Sitespeed.io. Our hearts are filled with appreciation for these amazing projects and the communities that support them. We would like to extend a special thank you to (see the full list):
Contribute
Join the effort to make Sitespeed.io even better! Whether you’re a developer, writer, or UX expert, there are many ways you can contribute to the improvement of our tool. Check out our help section and full issue list for opportunities to get involved. And a big thank you to all those who have already made contributions through pull requests or ideas. Your support is greatly appreciated.


