Documentation / Google Web Vitals
Google Web Vitals
Using sitespeed.io
If you use Chrome/Edge, Google Web Vital metrics are collected automatically.
First Contentful Paint (FCP)
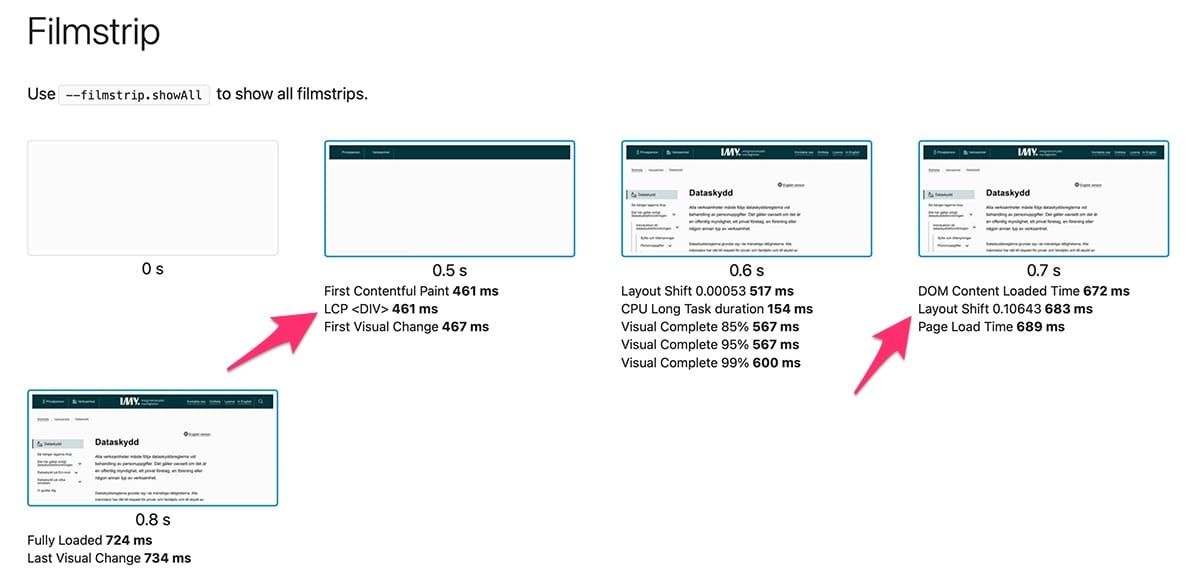
To see when the first contentful paint happens you should record a video and use visual metrics --video --visualMetrics. Then you can go to the filmstrip or video view to see when the first content is painted on the screen.
To collect the metric first contentful paint we use the Paint Timing API.
Largest Contentful Paint (LCP)
Go to the metrics tab and scroll down to the Largest Contentful Paint metrics and you will see a screenshot where the largest element is highlighted in red.
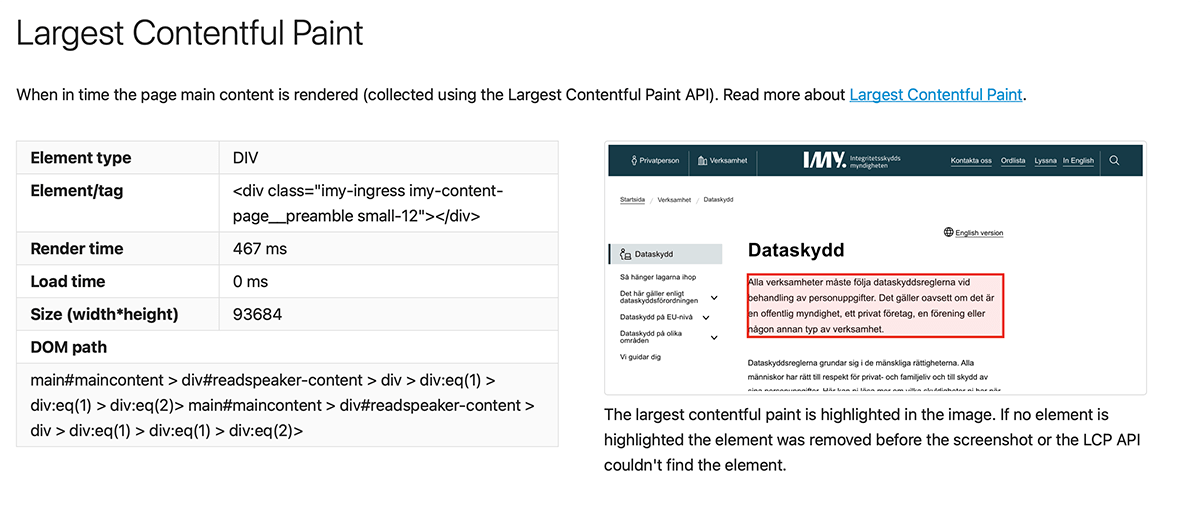
The screenshot is generated after the page has finished loading. If the largest contentful element has been removed from the screen by that time, you will not see any highlight in the screenshot. You can instead use the information in the table to the left to identify the element.
If you have a hard time identifying the element in the screenshot, you can change the colour of the highlighting with --browsertime.screenshotLCPColor blue.
If the largest contentful paint is an image you can also see that highlighted in the waterfall. 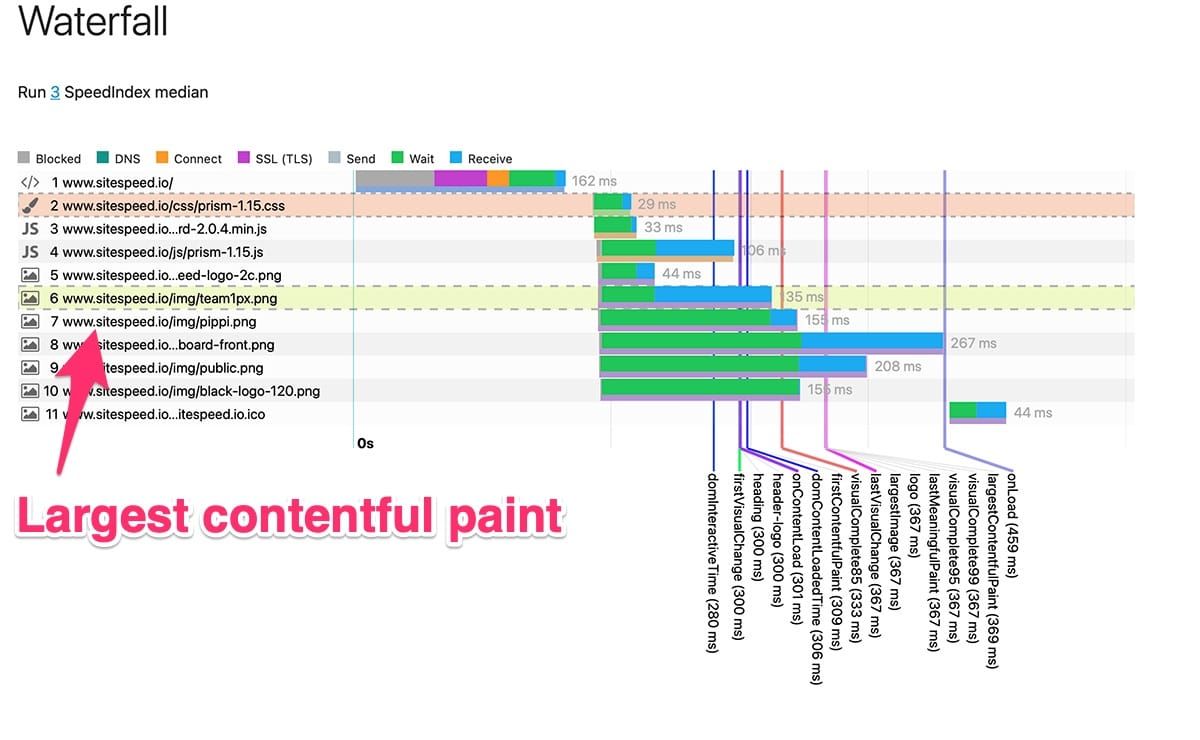
Cumulative Layout Shift (CLS)
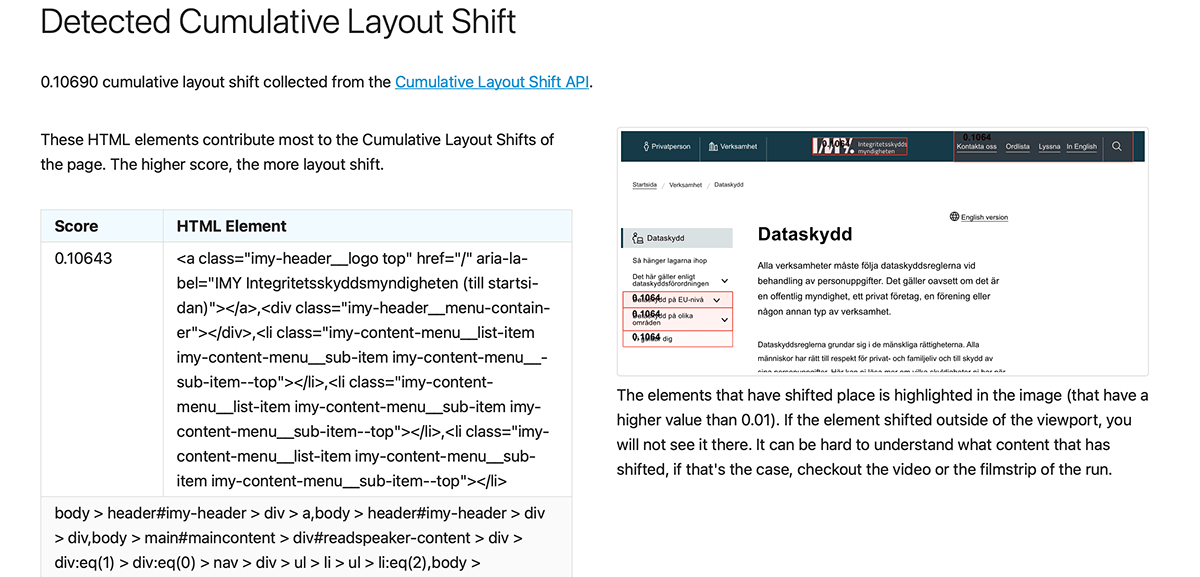
The layout shift API helps you find the DOM elements that shift on the screen and degrade the user experience.
If those elements are still in the viewport after the page has finished loading, we try to highlight them in a screenshot. By default all elements that have a shift value of 0.01 or higher are highlighted. You can change that with --browsertime.screenshotLSLimit. That can help you if you have a lot of elements that shift. Say that you want to highlight only elements with a value higher than 0.1, then add --browsertime.screenshotLSLimit 0.1 to your run settings.
You can also change the colour of the highlight: --browsertime.screenshotLSColor blue
Remember that the API points out the element that has shifted, not the element that actually pushed the other element.
Interaction to Next Paint (INP)
INP is the Core Web Vital for responsiveness — it measures the latency of every user interaction with the page and reports the worst (or near-worst) one. To get INP you need to actually interact with the page, which means scripting. Once interactions happen, sitespeed.io collects INP via the Event Timing API and surfaces it on the metrics tab next to LCP and CLS.
Total Blocking Time (TBT) / First Input Delay
Total blocking time is harder to measure: it really depends on what CPU you use when you run your tests (test on real mobile phones!). Total blocking time uses the Long Tasks API to get long-running tasks. The API has very limited support for showing what causes the long tasks. Note that INP has replaced FID as a Core Web Vital — TBT remains a useful lab proxy when you can't drive interactions in scripting.
The best way to get valuable information is to use --cpu to get the Chrome trace log to download and drag and drop into the performance tab of DevTools in Chrome. If you need a deeper trace log (with more information) you can add extra trace categories to the tracelog. The CPU profiler does that: --browsertime.chrome.traceCategory disabled-by-default-v8.cpu_profiler.
Calibrating metrics against CrUX 75 percentile
Using the Chrome User Experience plugin you can get the metrics of what your users are experiencing, and you can use those values to try to calibrate the metrics you get out of sitespeed.io.
It can be hard though, since in the real world people use a lot of different devices with different CPUs, many different connectivities, and so on. The easiest thing to calibrate is to have the same first contentful paint in your sitespeed.io test as in your Chrome user experience data. Do that by increasing/decreasing the connectivity until you have approximately the same values.
Budget
You can easily run your budget tests against Google Web Vitals. First create a budget configuration file.
{
  "budget": {
    "googleWebVitals": {
      "firstContentfulPaint": 500,
      "largestContentfulPaint": 1200,
      "totalBlockingTime": 200,
      "cumulativeLayoutShift": 0
    }
  }
}
And then run:
docker run --rm -v "$(pwd):/sitespeed.io" sitespeedio/sitespeed.io:42.5.1 --budget.configPath budget.json https://www.sitespeed.io/Metrics in Graphite and Grafana
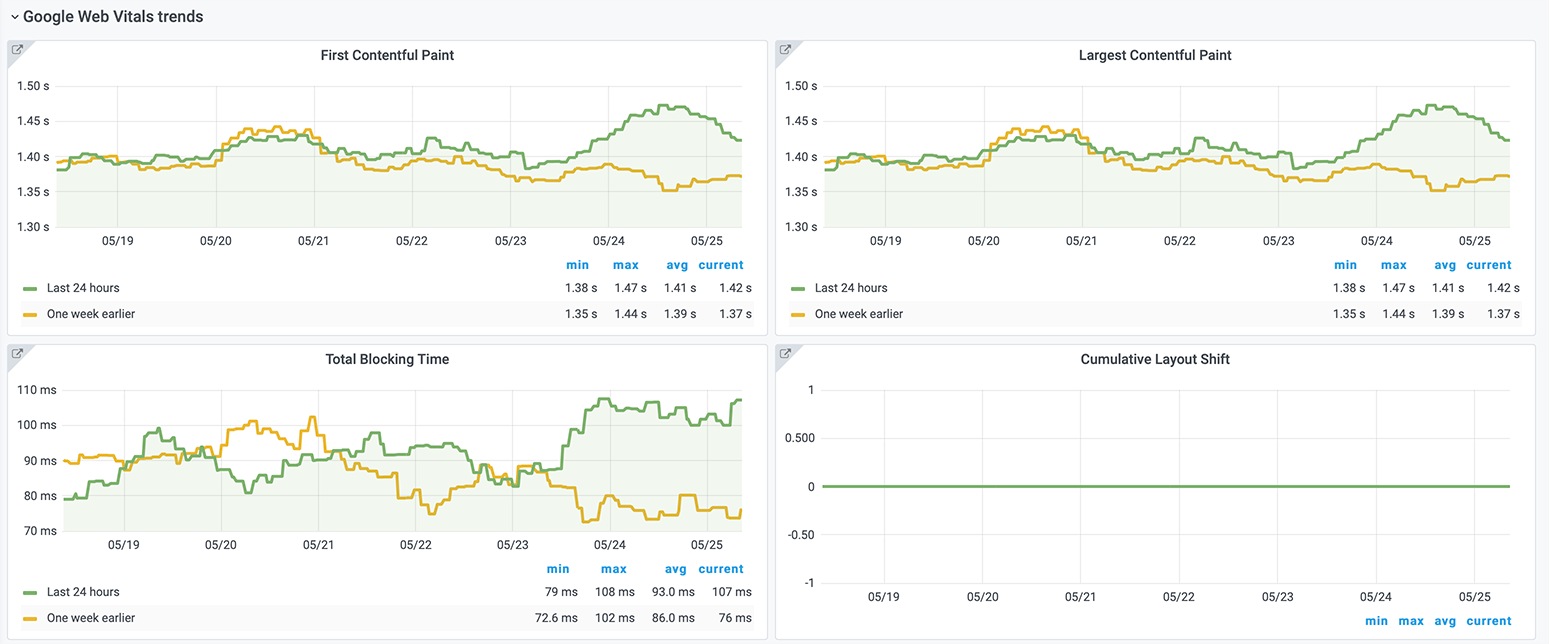
Our pre-made dashboards include Google Web Vitals where you can see latest metrics and trends compared to last week.
Bug reports
If you don't get the correct metrics, it could either be a bug in the browser API or in sitespeed.io.
To verify and check that the metrics seem to be correct, you can load your page in Chrome and then copy/paste the following snippets into the console and look at the console log. That is useful if you want to file a bug for Chrome.
To get the first contentful paint:
(function() {
    const entries = window.performance.getEntriesByType('paint');
    for (const entry of entries) {
        console.log(entry);
    }
})();
To get the largest contentful paint element:
(function() {
const observer = new PerformanceObserver(list => {});
  observer.observe({ type: 'largest-contentful-paint', buffered: true });
  const entries = observer.takeRecords();
  if (entries.length > 0) {
    const largestEntry = entries[entries.length - 1];
    console.log(largestEntry);
  }
})();
To get the layout shift information you can run:
(function() {
const observer = new PerformanceObserver(list => {});
  observer.observe({ type: 'layout-shift', buffered: true });
  const entries = observer.takeRecords();
   for (let entry of entries) {
    if (entry.hadRecentInput) {
      continue;
    }
    console.log(entry);
  }
})();
And to get the long tasks you can use:
(function() {
const observer = new PerformanceObserver(list => {});
  observer.observe({ type: 'longtask', buffered: true });
  const entries = observer.takeRecords();
   for (let entry of entries) {
    console.log(entry);
  }
})();
If you suspect the bug is in sitespeed.io, please file an issue in sitespeed.io.
Using CrUX
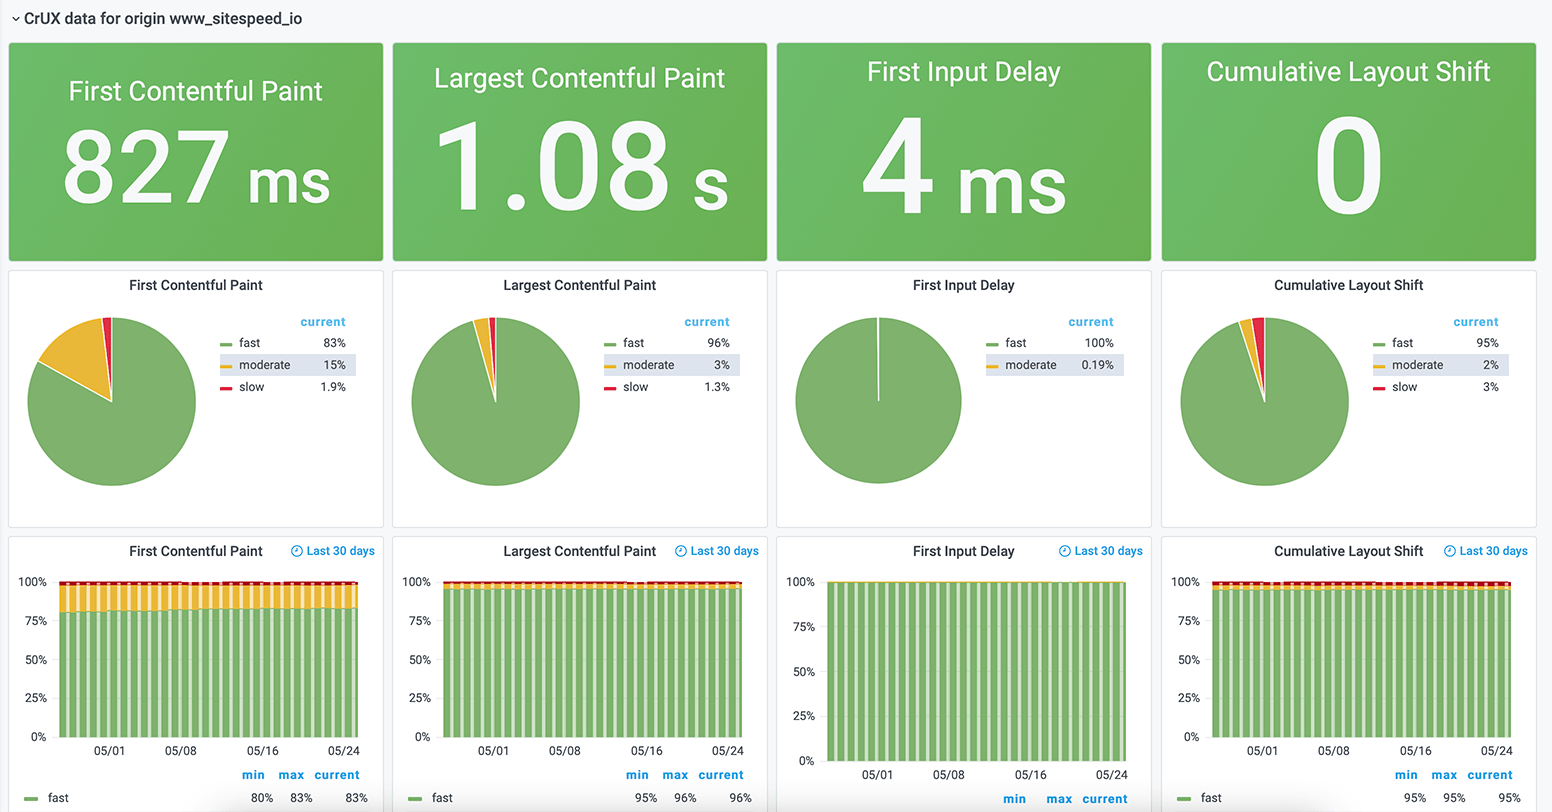
Sitespeed.io comes with a Chrome User Experience plugin. That makes it easy to get the metrics that Google collects from your users. You can compare them with the ones you get from sitespeed.io.
Sending the CrUX data to Graphite, you can see metrics both per URL and per origin.
Go to the CrUX documentation on how to set it up.
Using Lighthouse
Use the Lighthouse plugin to run Lighthouse from sitespeed.io and collect Google Web Vitals.