Documentation / Developers
Developers
How it all works
Almost everything we do is written in Node.js (use the latest LTS).
Built upon Open Source
Sitespeed.io uses a lot of other Open Source tools so massive love to those projects and maintainers:
- Selenium
- Visual Metrics
- PerfCascade
- Skeleton
- Simple crawler
- Pug
- all other projects in the package.json.
And we also have plugins so that you can use:
- WebPageTest through the WebPageTest API
- gpagespeed
And of course we use all the tools in the sitespeed.io suite.
Analyse a page, what happens
Check out the description in the browser docs.
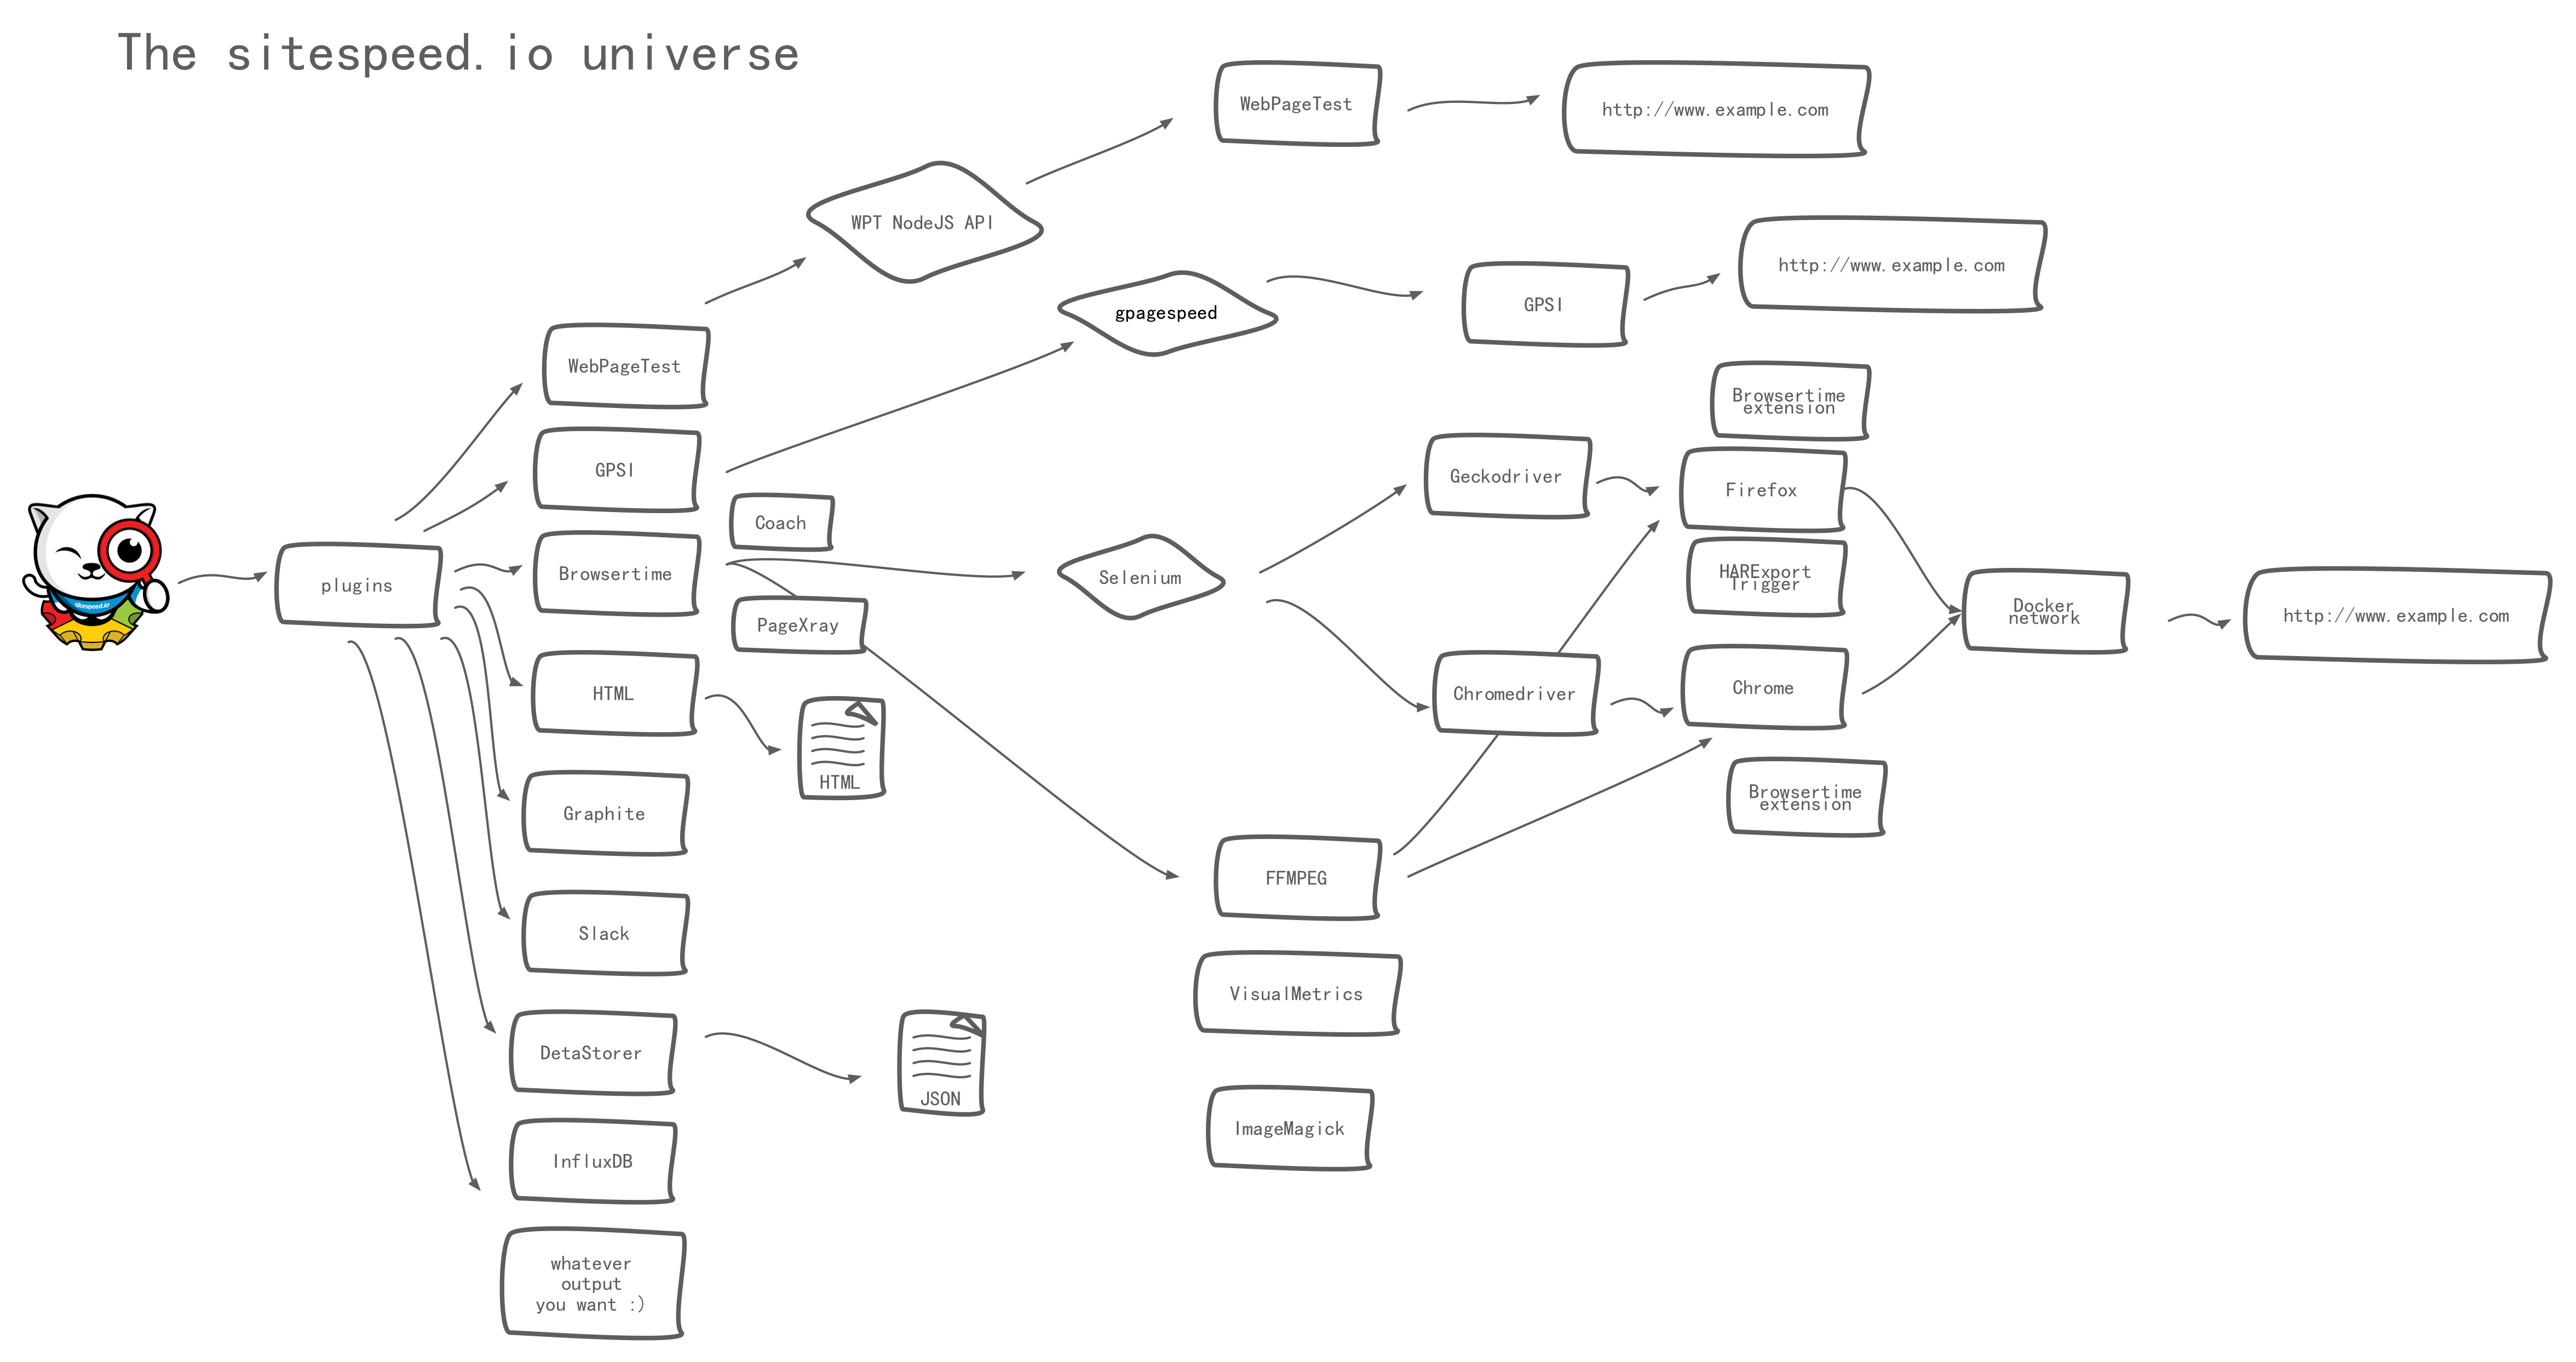
The big picture (with all the tools)
The big picture looks something like this:
Use directly from Node.js
Use sitespeed.io from Node.js
Here's an example of how to use sitespeed.io directly from Node.js. This will generate the result to disk but you will not get it as a JSON object (only the budget result). We may change that in the future. If you need the JSON you can either read it from disk or use the Browsertime plugin directly.
import { run as runSitespeedio } from 'sitespeed.io';
const urls = ['https://www.sitespeed.io/'];

async function run() {
  try {
    const result = await runSitespeedio({
      urls,
      browsertime: {
        iterations: 1,
        browser: 'chrome'
      }
    });
    console.log(result);
  } catch (error) {
    console.error(error);
  }
}

await run();
Use Browsertime from Node.js
In this example you run Browsertime directly from Node.js, using the default JavaScript to collect metrics.
import { BrowsertimeEngine, browserScripts } from 'browsertime';

// The setup is the same configuration as you use in the CLI
const browsertimeSetupOptions = { iterations: 1, browser: 'chrome' };
const engine = new BrowsertimeEngine(browsertimeSetupOptions);
// You can choose what JavaScript to run, in this example we use the default categories
// and the default JavaScript
const scriptCategories = await browserScripts.allScriptCategories();
let scriptsByCategory = await browserScripts.getScriptsForCategories(
  scriptCategories
);

async function run() {
  try {
    await engine.start();
    // Get the result
    const result = await engine.run('https://www.sitespeed.io/',  scriptsByCategory);
    console.log(result);
  } catch (e) {
    console.error(e);
  } finally {
    await engine.stop();
  }
}

await run();
Developing sitespeed.io
Setup
On your local machine you need:
- Install Node.js latest LTS version.
- You need Git and fork sitespeed.io and clone the forked repository.
- Install Chrome/Firefox/Edge
- Go to the cloned directory and run
npm install - You are ready to go! To run locally:
bin/sitespeed.js https://www.sitespeed.io -n 1 - You can change the log level by adding the verbose flag. Verbose mode prints progress messages to the console. Enter up to three times (-vvv) to increase the level of detail:
bin/sitespeed.js https://www.sitespeed.io -n 1 -v
To run the Docker version:
- Install Docker Community Edition
- You need to fork and clone sitespeed.io.
- Run
docker build -t sitespeedio/sitespeed.io .in the cloned directory to build the container - Run
docker run --shm-size=1g --rm -v "$(pwd):/sitespeed.io" sitespeedio/sitespeed.io https://www.sitespeed.io/
If you want to test and push to Graphite/InfluxDB:
- Go to docker/ in the cloned dir and start the container:
docker compose up - Go back one level and run
docker build -t sitespeedio/sitespeed.io .in the cloned directory to build the container - Run:
docker run --shm-size=1g --rm -v "$(pwd):/sitespeed.io" sitespeedio/sitespeed.io https://www.sitespeed.io -n 1 --graphite.host=192.168.65.1to push the data to Graphite. The IP is the localhost IP if you run on a Mac. - Check the metrics at http://127.0.0.1:3000/.
If you are new to Git/GitHub and want to make a PR, you can start by reading Digital Ocean's tutorial on how to make PRs.
We use main as our default branch, send all PRs to main.
Log and debug
To get a better understanding of what happens you should use the log. You can change log level by using multiple -v. If you want to log at the lowest level and get all information, you can use -vvv. If that is too much information, use -vv or -v.
You can also debug all the messages sent inside of the queue of sitespeed.io. That way you can see how plugins are communicating with each other. To turn that on use --debugMessages.
Plugins
Everything in sitespeed.io (well almost everything) is a plugin. Each plugin will be called, for each message sent in the application and then called when everything is finished.
The plugin structure looks like that.
Using Pug
We use Pug as the template for the HTML. If you are used to debugging with console.log, we have a special feature for you. We pass JSON to the templates, so if you want to output the data structure in the HTML you can easily do that by just adding:
p #{JSON.stringify(pageInfo)}
Where pageInfo is the data structure that you want to inspect.
If you are new to Pug you can use https://html2jade.org to convert your HTML to Pug.
Make a pull request
We love pull requests, and before you make a big change or add functionality, please open an issue proposing the change to other contributors so you get feedback on the idea before taking the time to write precious code!
When you make your pull request, you can follow the guide from GitHub on how to make a pull request from a fork.
Before you send the pull request
Before you send the PR, make sure you:
- Squash your commits so it looks sane
- Make sure your code follows our lint rules by running:
npm run lint, and usenpm run lint:fixif you have any breaking rules - Make sure your code doesn't break any tests:
npm test - Update the documentation https://github.com/sitespeedio/sitespeed.io/tree/main/docs in another pull request. When we merge the PR, the documentation is automatically updated, so we do that when we push the next release.
Debug metrics
Sometimes you want to verify that the metrics are correct, how do you do that?
Visual metrics
The best way to verify that visual metrics are correct is to look at the filmstrip view and verify that the metrics correlate with the filmstrip. Through the years, browsers have changed the URL bar or added small infoboxes at the bottom of the browser window that affect visual metrics. You can easily see if those are picked up by looking at the filmstrip.
If you don't have the filmstrip, you can compare first visual change from visual metrics with first contentful paint, they usually match pretty well.
Do a sitespeed.io release
When you become a member of the sitespeed.io team you can push releases. You do that by running the release bash script in root: ./release.sh
You need NodeJS, Docker, np (npm install --global np), Firefox and Chrome installed on your machine.
To be able to release a new version you need to have access to our Docker account, npm, our GitHub repos, and 2FA.
To do a release you need to first install np (a better npm publish): npm install --global np
Before you do a release, remember to let your latest code change run for a couple of hours on our test server before you push the release (the latest code is automatically deployed on the test server). You will find errors from the test server on the #alert channel on Slack.
Do the release:
- Make sure you have a clean repo:
git status - Read through the CHANGELOG and see that all changes are included and add the version + date at the top for the new release and commit the change.
- Run
./release.sh - Choose version
- Login into Docker, add your 2FA when prompted
- When a new browser window opens at GitHub with the release, copy/paste the changes from the CHANGELOG and add it instead of the commits and create the release.
- Commit the updated version file and the configuration file if that's changed.
Do a Browsertime release
When you become a member of the Browsertime team you can push releases. You do that by running the release bash script in root: ./release.sh
You need NodeJS, Docker, np (npm install --global np), Firefox and Chrome installed on your machine.
To be able to release a new version you need to have access to our Docker account, npm, our GitHub repos, and 2FA.
You also need to have the sitespeed.io repo at the same level as your checked-out Browsertime repo, so that the documentation can be automatically updated.
Before you do a release, make sure the latest commit is green on the Browsertime GitHub Actions.
Do the release:
- Make sure you have a clean repo:
git status - Read through the CHANGELOG and see that all changes are included and add the version + date at the top for the new release and commit the change.
- Run
./release.sh(if CI is green you can run./release.sh --yoloto skip the local tests) - Choose version
- Login into Docker, add your 2FA when prompted
- When a new browser window opens at GitHub with the release, copy/paste the changes from the Changelog and add it instead of the commits.
- Commit the updated version file and the configuration file in the sitespeed.io repo. Or make a PR if you do not have commit rights.
Contributing to the documentation
The documentation lives in your cloned directory under docs/ and is built with Eleventy (search uses Pagefind). You need Node.js (see docs/package.json for the supported version).
To run the documentation server locally, execute the following from within the /docs directory after cloning the repo:
npm install
npm run serve
Visit the URL Eleventy prints (default http://localhost:8080/) in the browser of your choice.
Debugging with Chrome
You can debug sitespeed.io using Chrome and NodeJS > 8. Thanks @moos for sharing.
node --inspect-brk bin/sitespeed.js -n 1 https://www.sitespeed.ioAnd you will get something like this:
Debugger listening on ws://127.0.0.1:9229/28ca21e5-1300-45ee-a455-481cb96220eb
For help see https://nodejs.org/en/docs/inspector
Debugger attached.
Then copy & paste chrome://inspect/ into Chrome and choose Open dedicated DevTools for Node. --inspect-brk ensures a breakpoint as soon as the code is entered. From there, you can start any of the profiles under the Profile tab.
Use it when you want to debug functionality or check memory usage.