sitespeed.io 9.0
Today we pushed the greatest version of sitespeed.io so far: 9.0. You now get a lot more insights of where your page spends CPU time and we also makes it easier to pinpoint 3rd party problems. A lot of the new shiny things is Chrome only but we will add support for Firefox when Mozilla implements the functionality.
We also have a new version of the logo (made by Mochamad Arief as always) to celebrate the new release:

sitespeed.io - saving the world before your bedtime
Let us go through all the new things:
- Third party love
- CPU metrics in Chrome
- Default config file
- Lighthouse
- Include the HTML in the HAR file
- Changelog
Third party love #
A couple of releases ago we started to use Patrick Hulce great third party web. It makes it possible to track number of third parties request, number of tools, categorise each tool and with the latest release we also track CPU time spent per tool.
Requests per page #
There’s a lot of discussion blaming 3rd parties for performance and it’s now easier for you track them. You need to remember that third parties is also used to share private data of what your user is doing to other companies. Remember that privacy is important for your users. That’s why made it easier to see how many third party request each page do:
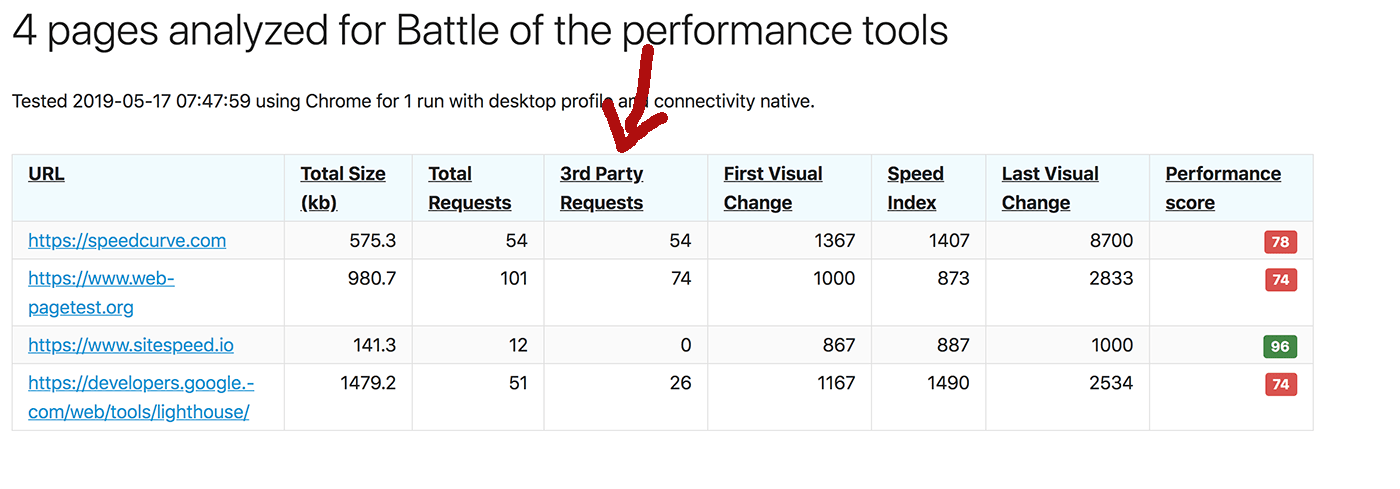
It's easy to see the amount of third party requests.
In the 8.9 release you can read about the other 3rd party stuff we released lately.
CPU spent per tool/third party #
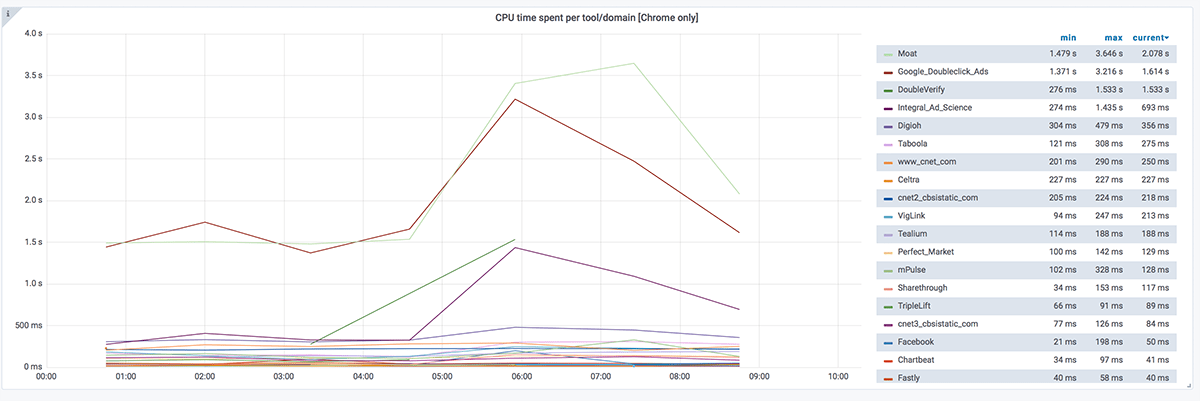
You can now track CPU spent per tool/third party. It’s turned off by default and enable it with --thirdParty.cpu when you use Chrome. Then you can have a graph like this:
The Grafana dashboards are updated to include the new metrics if you use Graphite. You can download the new page timing metric dashboard.
Easier way of blocking 3rd parties #
We have support to block specisfic third parties with --block but that isn’t the most user friendly way if you wanna test you site without third parties. That’s why we added support for blocking every domain except the one you configure (inspired by WebPageTest). Use --chrome.blockDomainsExcept to block all domains except. Use it multiple times to keep multiple domains. You can also use wildcard like *.sitespeed.io!
CPU metrics in Chrome #
We spent a lot of time to use all of those cool thing you can get out of Chrome about where the CPU time is spent for a page.
Say hello to Tracium #
We have replaced Chrome-trace with Tracium in #816. The library has been broken out of Lighthouse by Andrey Lushnikov of the Chrome DevTools team. Much love :) This helps us focus on sitespeed.io stuff instead of Chrome internals.
You can enable it with --chrome.timeline or --cpu. It also means three changes:
- We skipped reporting all internal events inside of Chrome and only report events that takes more than 10 ms. We do this because it makes it easier to understand which events actually takes time and are useful.
- Instead of reporting: Loading, Painting, Rendering, Scripting and Other we now report the same categories as Tracium: parseHTML, styleLayout, paintCompositeRender, scriptParseCompile, scriptEvaluation, garbageCollection and other. This gives you a little more insights of CPU time spent.
- We collect more trace log than before (following Lighthouse, the trace log will be larger on disk), this makes it easier for you when you want to debug problems. But it can also introduce a little slower Chrome depending on what instance size you use. If your timing metrics increase when you upgrade, it’s because of the log.
We alo moved all CPU metrics to a new tab called … wait a minute .. CPU! It’s now much easier to find the metrics.
Long Tasks #
You can collect CPU long tasks in Chrome using --chrome.collectLongTasks (or just use --cpu) using the Long Task API. A long task is a CPU task that takes longer than 50 ms (but you can configure it, more about that later).
For the long tasks to work, we inject JS using the Page.addScriptToEvaluateOnNewDocument devtools command. We collect all long tasks and related data (not so much at the moment but will get better/more useful information when browsers supports it).
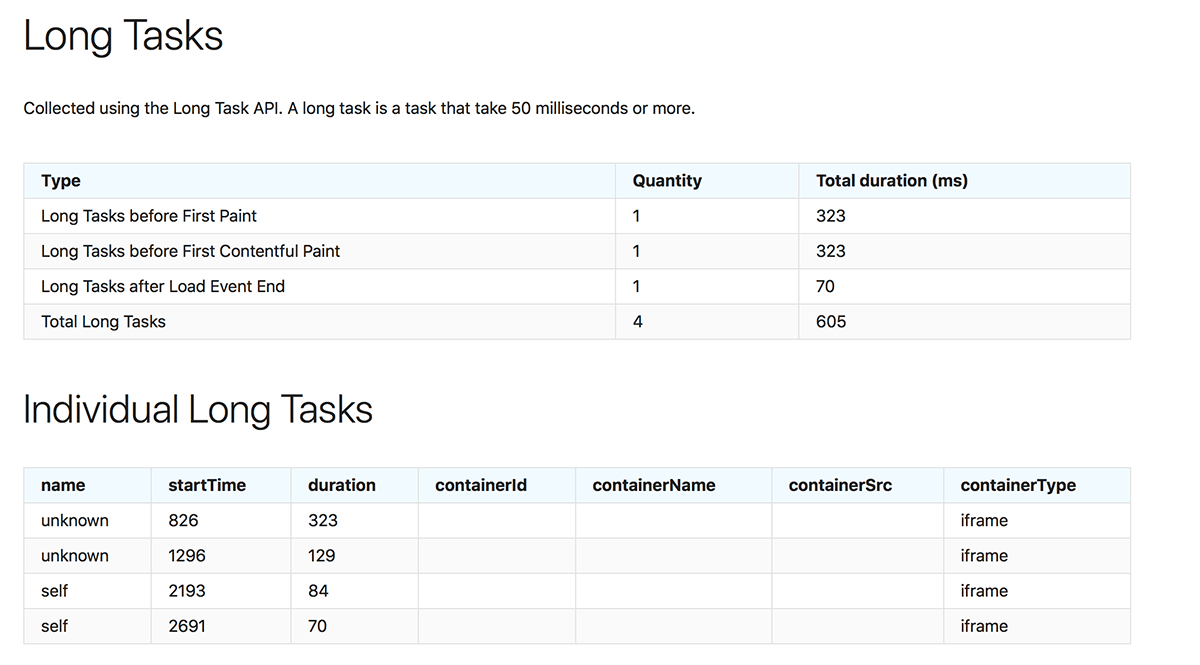
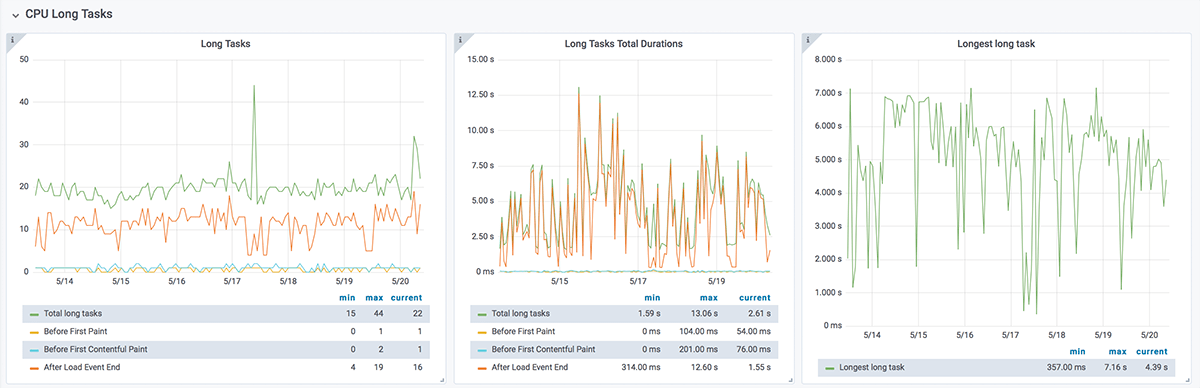
We count the total number of long tasks, long tasks that happens before first paint and first contentful paint. And the amount that happens after load event end. In Grafana the graphs will look like this:
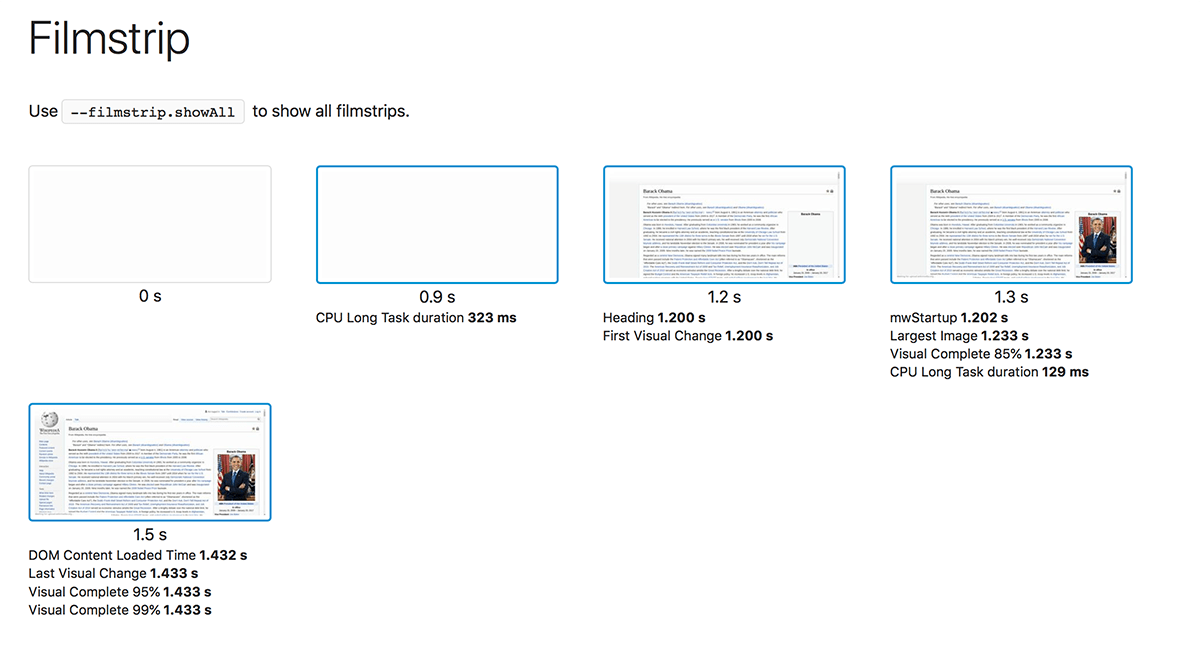
One neat feature is that we show when the long task happen in the filmstrip view. That makes it easier for you as a developer to show the impact of the long task to your boss.
But what about that magic number of 50 ms? Well it is possible that 50 ms isn’t the right number for you. By default a long task is >50ms. Wanna change that? Use --minLongTaskLength to set that yourselves (it needs to be larger than 50 ms though).
Throttle the CPU #
With the blessing from Pat Meenan in a tweet that the CPU throttling in Chrome works really good, we implemented it. Throttle the CPU using Chrome with --chrome.CPUThrottlingRate. Enables CPU throttling to emulate slow CPUs. Throttling rate as a slowdown factor (1 is no throttle, 2 is 2x slowdown, etc).
Default config file #
You can use a .sitespeed.io.json file that holds default config setup when you run sitespeed.io. Create it in and it in your folder where you run the command and it will automatically be picked up.
Lighthouse #
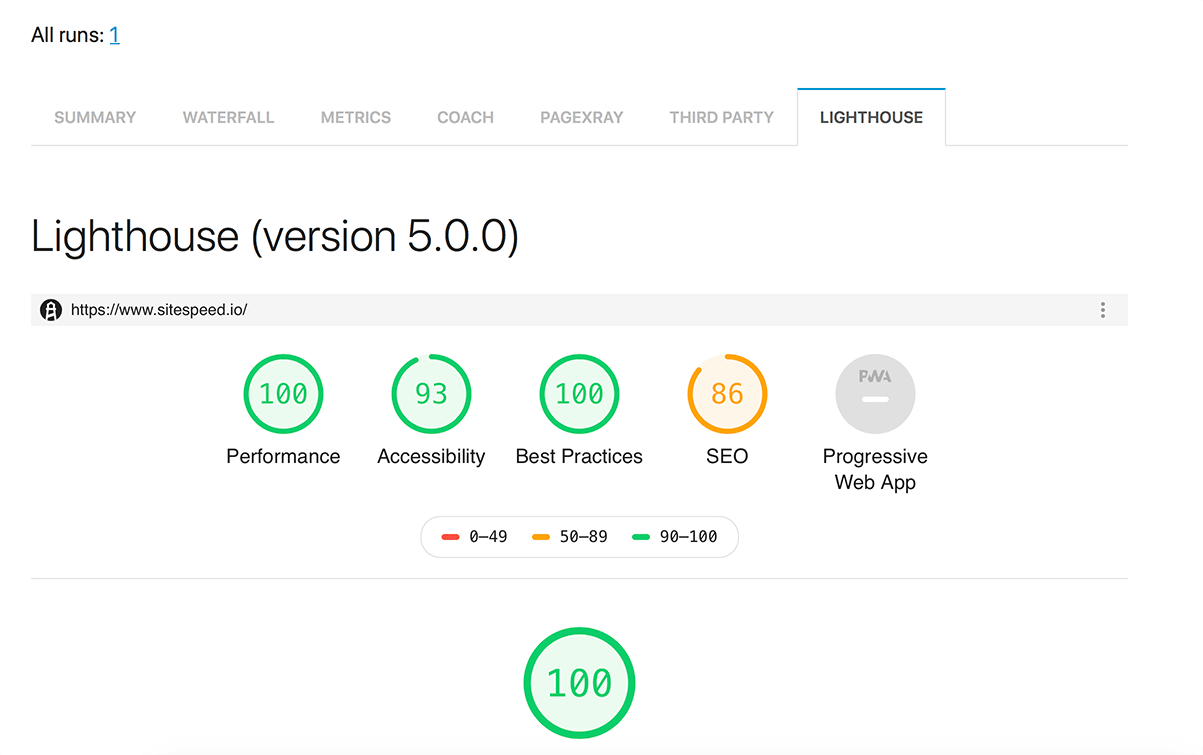
If you use the G+ container, Lighthouse has changed:
The container uses Lighthouse 5.0, output HTML by default that is iframed into sitespeed.io. That means instead of seeing just the cherry picked metrics, you will see the full Lighthouse result.
Include the HTML in the HAR file #
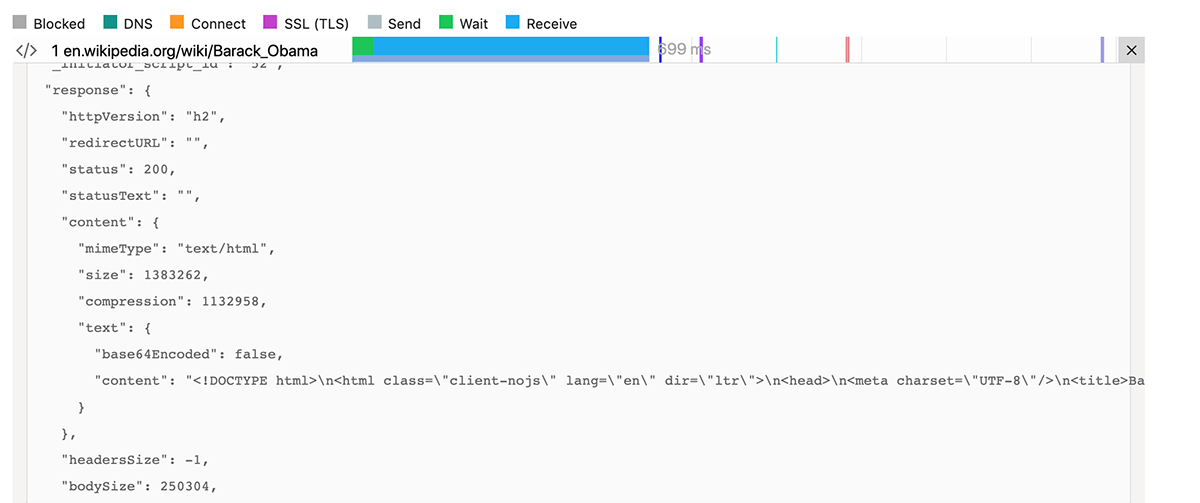
One use cases with continuously collecting a HAR file is that you also can include the content of the HTML page in the HAR. We have had that functionality using Firefox and with the new release we also have it in Chrome.
Include the actual HTML in the HAR file for Chrome using --chrome.includeResponseBodies html.
We have some work todo to make the content more appealing, you can help us with that in PerfCascade #154.
At the moment you find the info in the raw tab:
Changelog #
To see all changes and the PRs you should read the changelog.
Remember when you upgrade there are two things that can change: Metrics could be a little slower in Chrome since we now collect more trace log (only when you turn on CPU tracing) and there are new categoris for the CPU trace! If you use Lighthouse and had your own hack for including the HTML, that isn’t needed any more.
Happy performance testing!
/Peter