sitespeed.io 7.0
A couple of weeks ago we released Browsertime 3.0 completely rewritten and now we are ready to push sitespeed.io 7.0 using the latest version of Browsertime.
- New in 7.0
- Most important things first: Breaking changes
- Browsertime 3
- New Chrome and latest Firefox 61
- WebPageReplay support using Docker
- A lot of love for WebPageTest
- Statsd support
- New S3 plugin
- Console messages from Chrome
- Use the same parameters Browsertime/sitespeed.io
- CPU data from Chrome
- Fixes
- Breaking changes for plugin makers
- What’s next
New in 7.0 #
Let me walk you through what’s new. The most important thing is the new version of Browsertime.
Most important things first: Breaking changes #
As a Docker user of sitespeed.io there shouldn’t be any breaking changes upgrading from latest 6 version. If you are using a preScript to login the user, you need to wait/verify that the page has actually loaded before you try to manipulate the page, since Browsertime 3.0 change pageLoadStrategy from *normal* to *none* meaning you will be in control direct after the navigation. - The page load strategy change was reverted in 7.0.2.
If you don’t use our Docker container (you should!) you need to use Firefox 61 (beta) to get the HAR from Firefox, since the new HAR Export trigger needs that version (the Docker container already contains 61).
One important thing: The upgrade to Firefox 61 in the Docker container and that we made Browsertime so much leaner and cleaner will probably make your timing metrics decrease when you switch to 7.0.
If you use custom made plugins that uses screenshots or the trace log from Chrome you should read this since the behavior how those are handled have changed.
Browsertime 3 #
In the new version we store metrics and data to disk between runs. That means screenshots/ tracelogs and other metrics are stored to disk immediately. This makes Browsertime use less memory when you do many runs. See #308 for a use case where that helps.
The CPU usage has also decreased, mainly since we switched to the new version of Firefox. Here’s an example of when we deployed an early version of 3.0 on AWS.
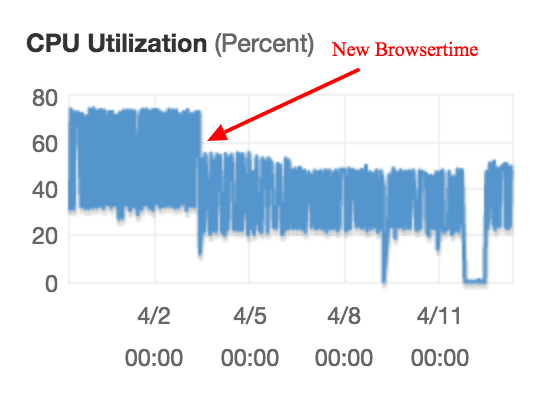
The red arrow shows when we installed the first alpha version of Browsertime
The decreased memory and CPU usage makes your metrics more stable.
Read more about the all changes in Browsertime 3.0.
New Chrome and latest Firefox 61 #
The Docker container uses the latest release of Chrome stable and a beta release of Firefox 61. We use Firefox 61 so that the new HAR Export trigger works.
WebPageReplay support using Docker #
We had it in alpha/beta for a while and now it’s there in our default container: WebPageReplay.
WebPageReplay is proxy that first records your web site and then replay it locally. That can help you find performance regression in the front-end code easier: Latency/server timings are constant.
You can run like this: docker run --cap-add=NET_ADMIN --shm-size=1g --rm -v "$(pwd):/sitespeed.io" -e REPLAY=true -e LATENCY=100 sitespeedio/sitespeed.io https://en.wikipedia.org/wiki/Barack_Obama
Here are a couple of examples from our real world tests. We test on Digital Ocean Optimized Droplets 4 gb memory with 2 vCPUs. We test both with connectivity set to cable (to try to minimize the impact of flaky internet) and one tests using WebPageReplay. We tests with the same amount of runs on the same machine.
Here’s an example from one of the sites we test. Here we test with connectivity set to cable. 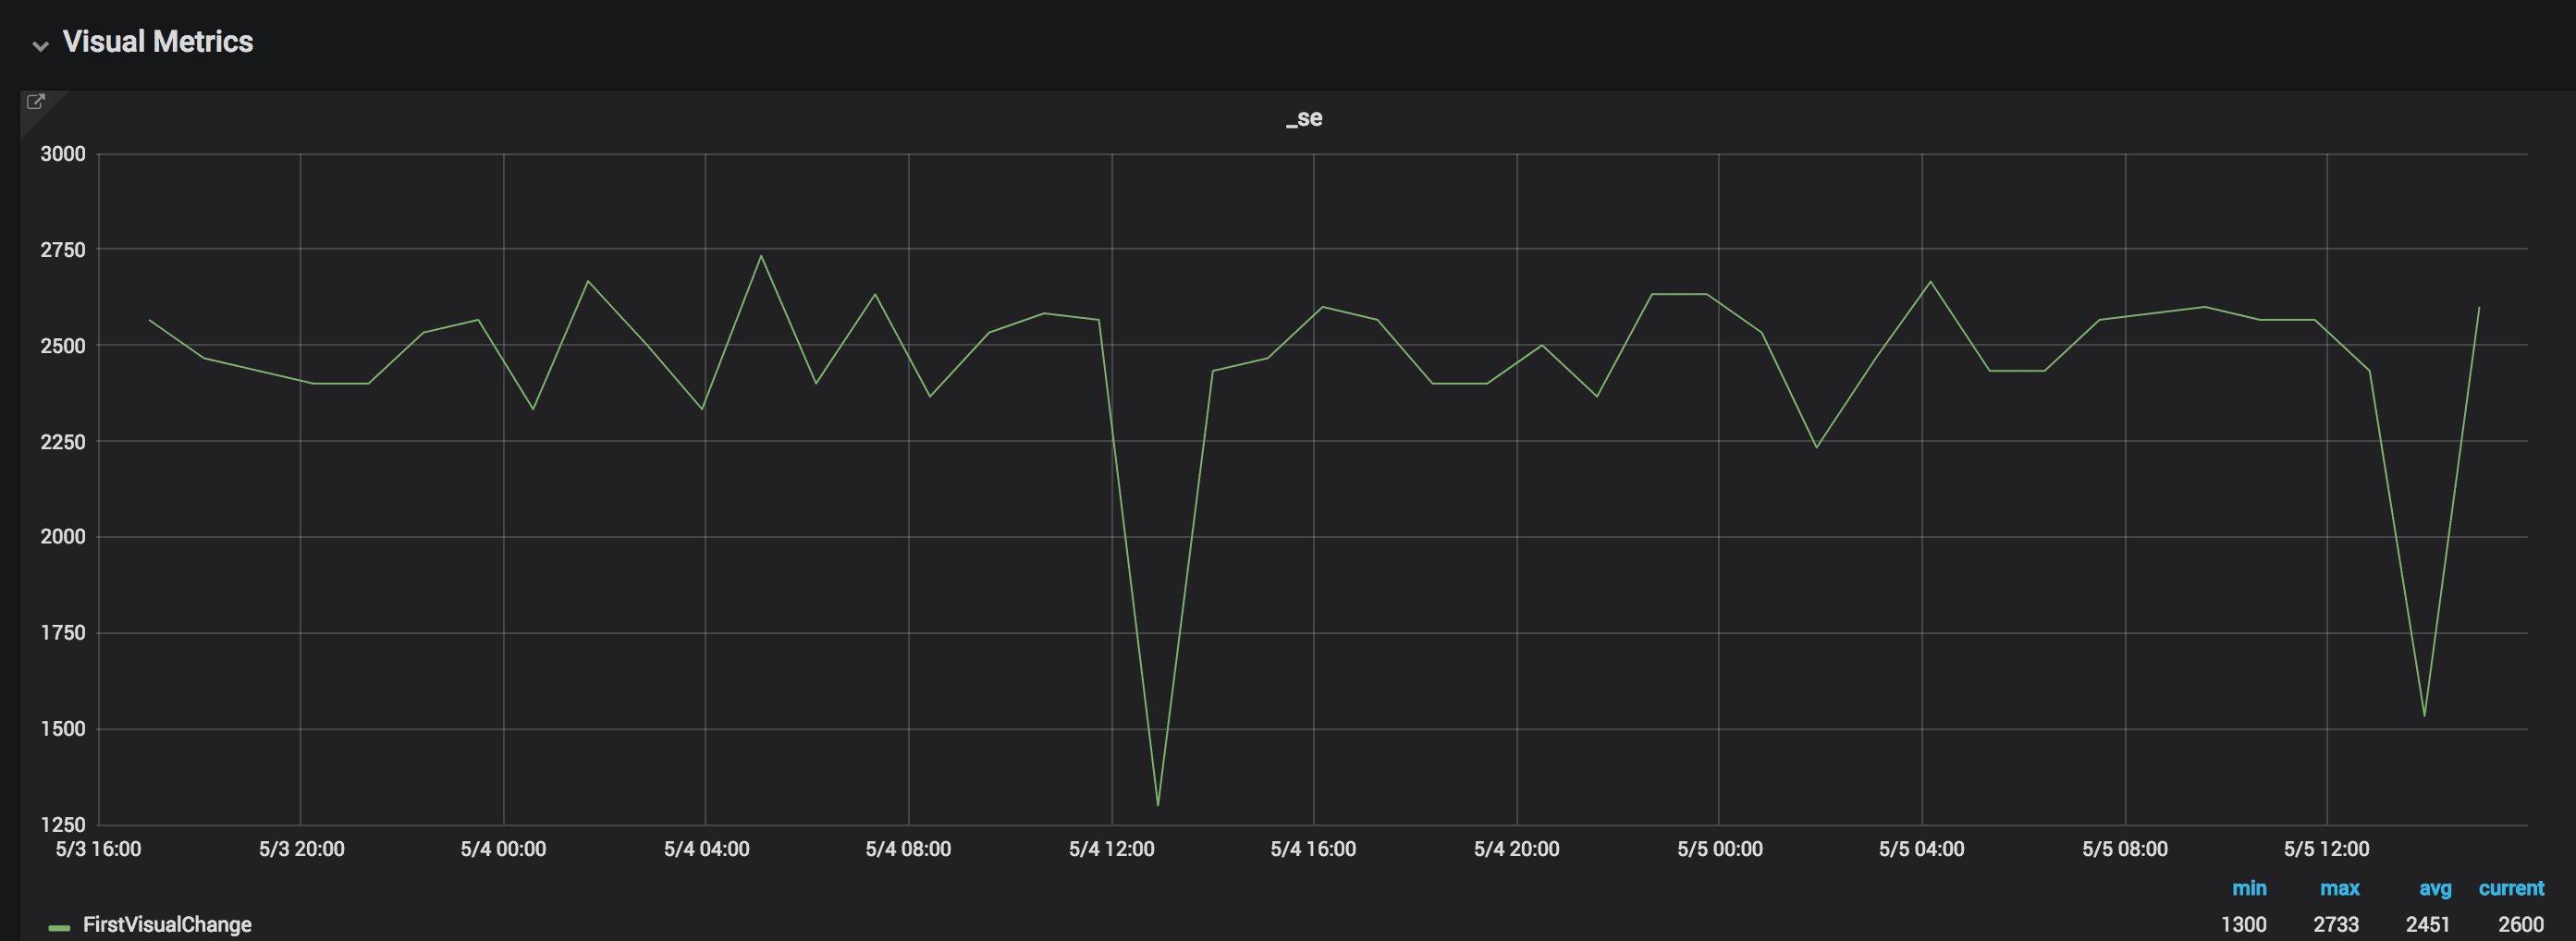
The variation is normally whopping 500 ms and max is over 1400 ms.
The same site using WebPageReplay, the same amount of runs:
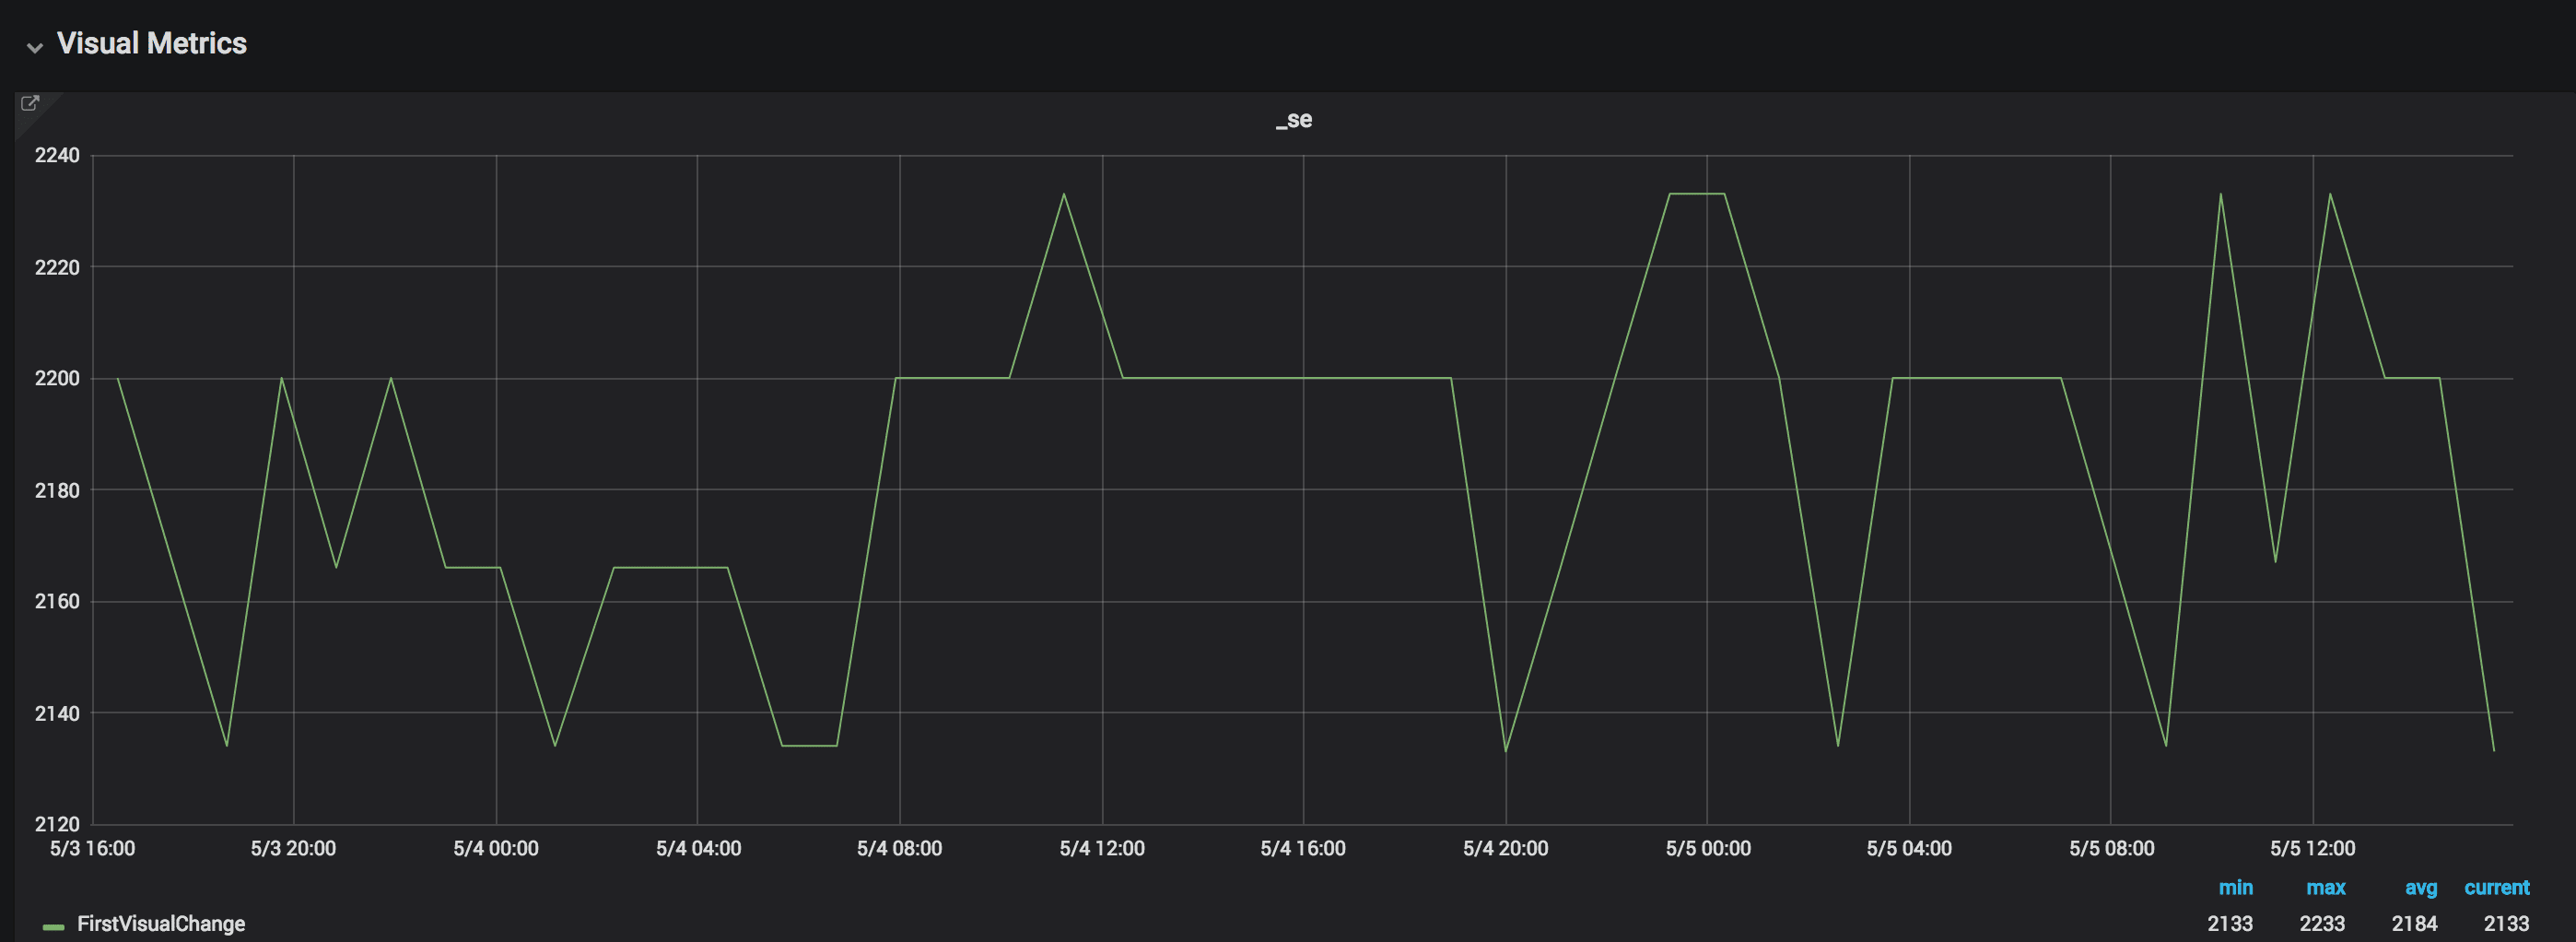
The difference is now less than 100 ms.
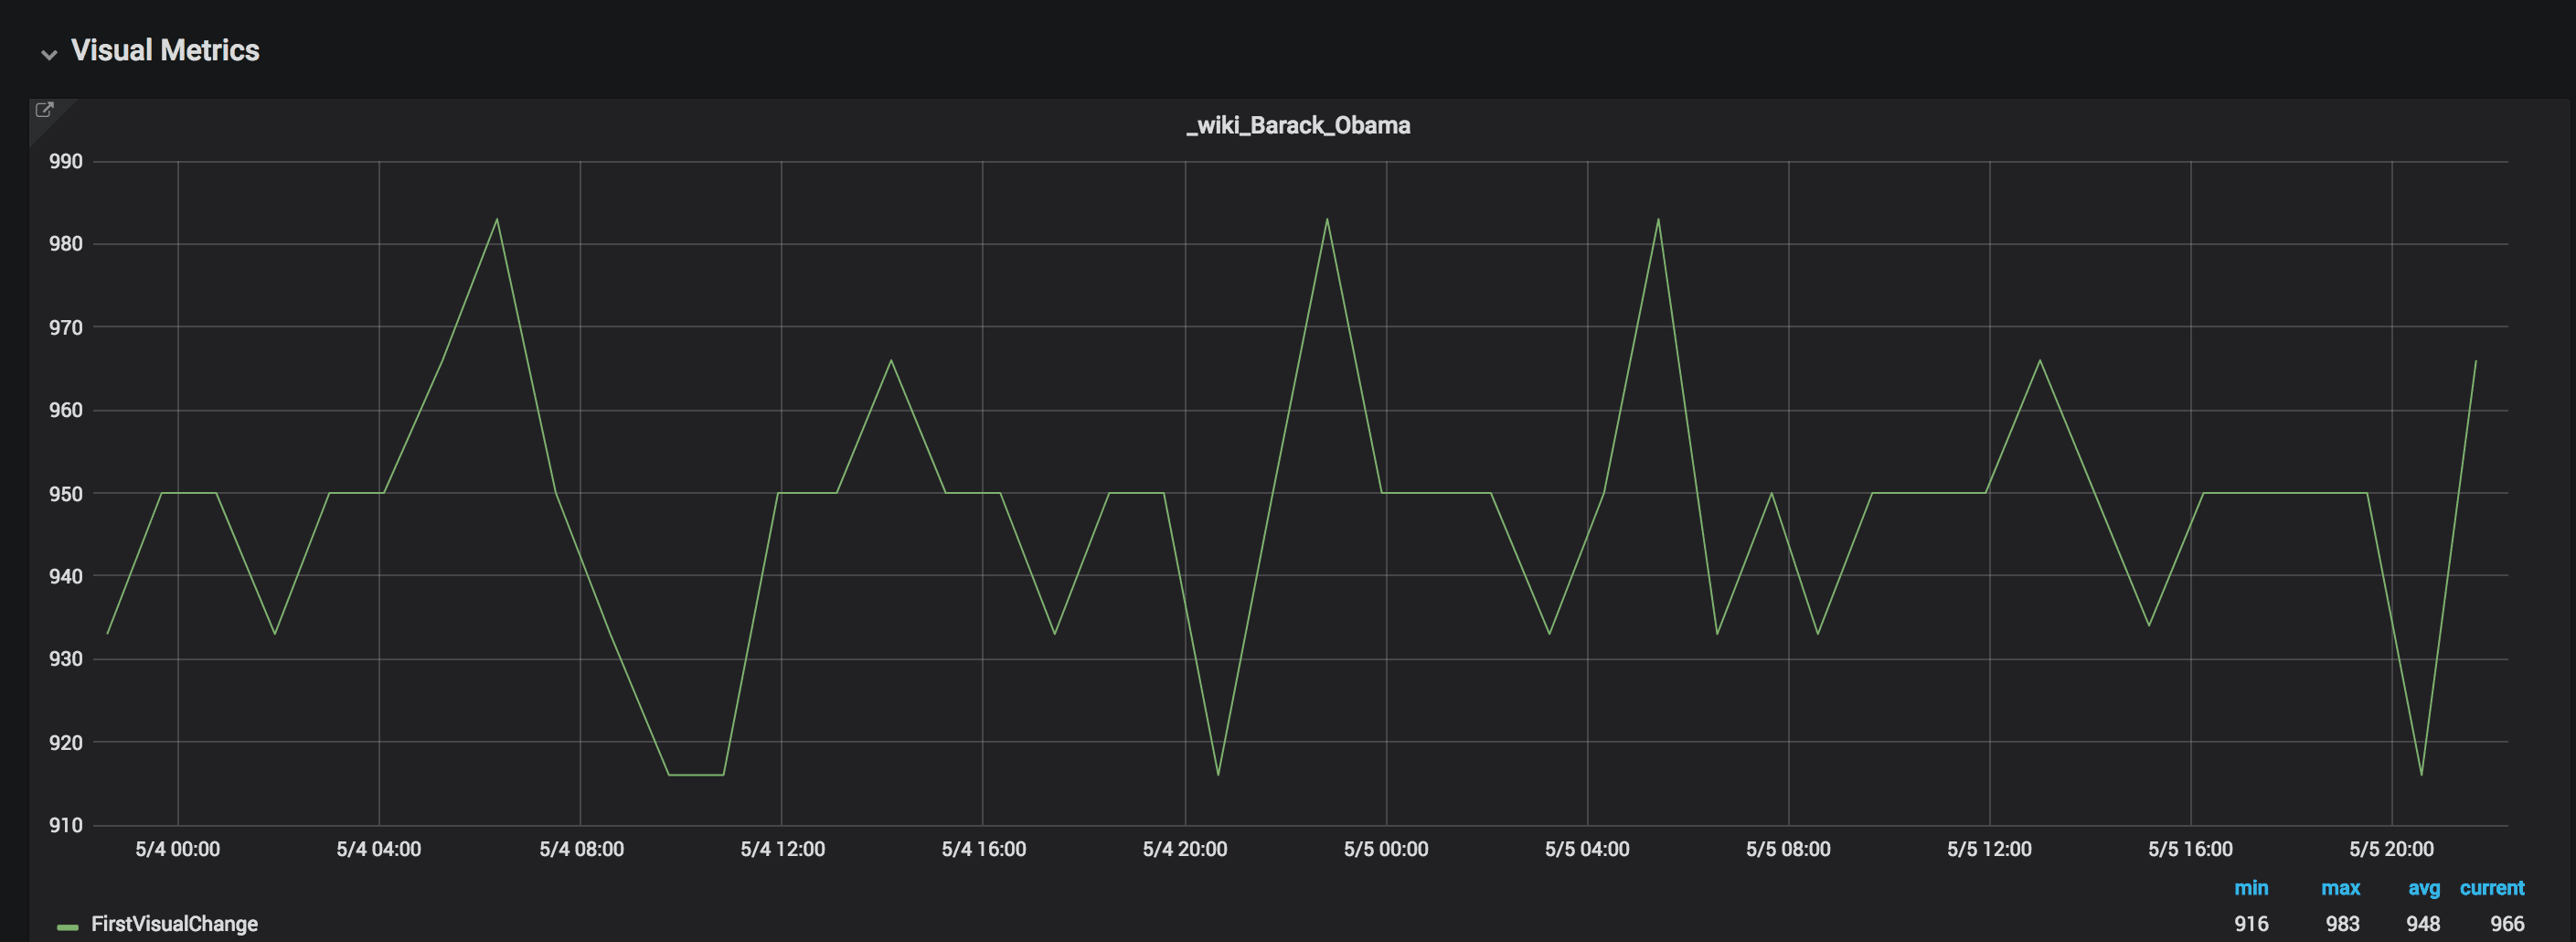
Here’s another site, setting connectivity:
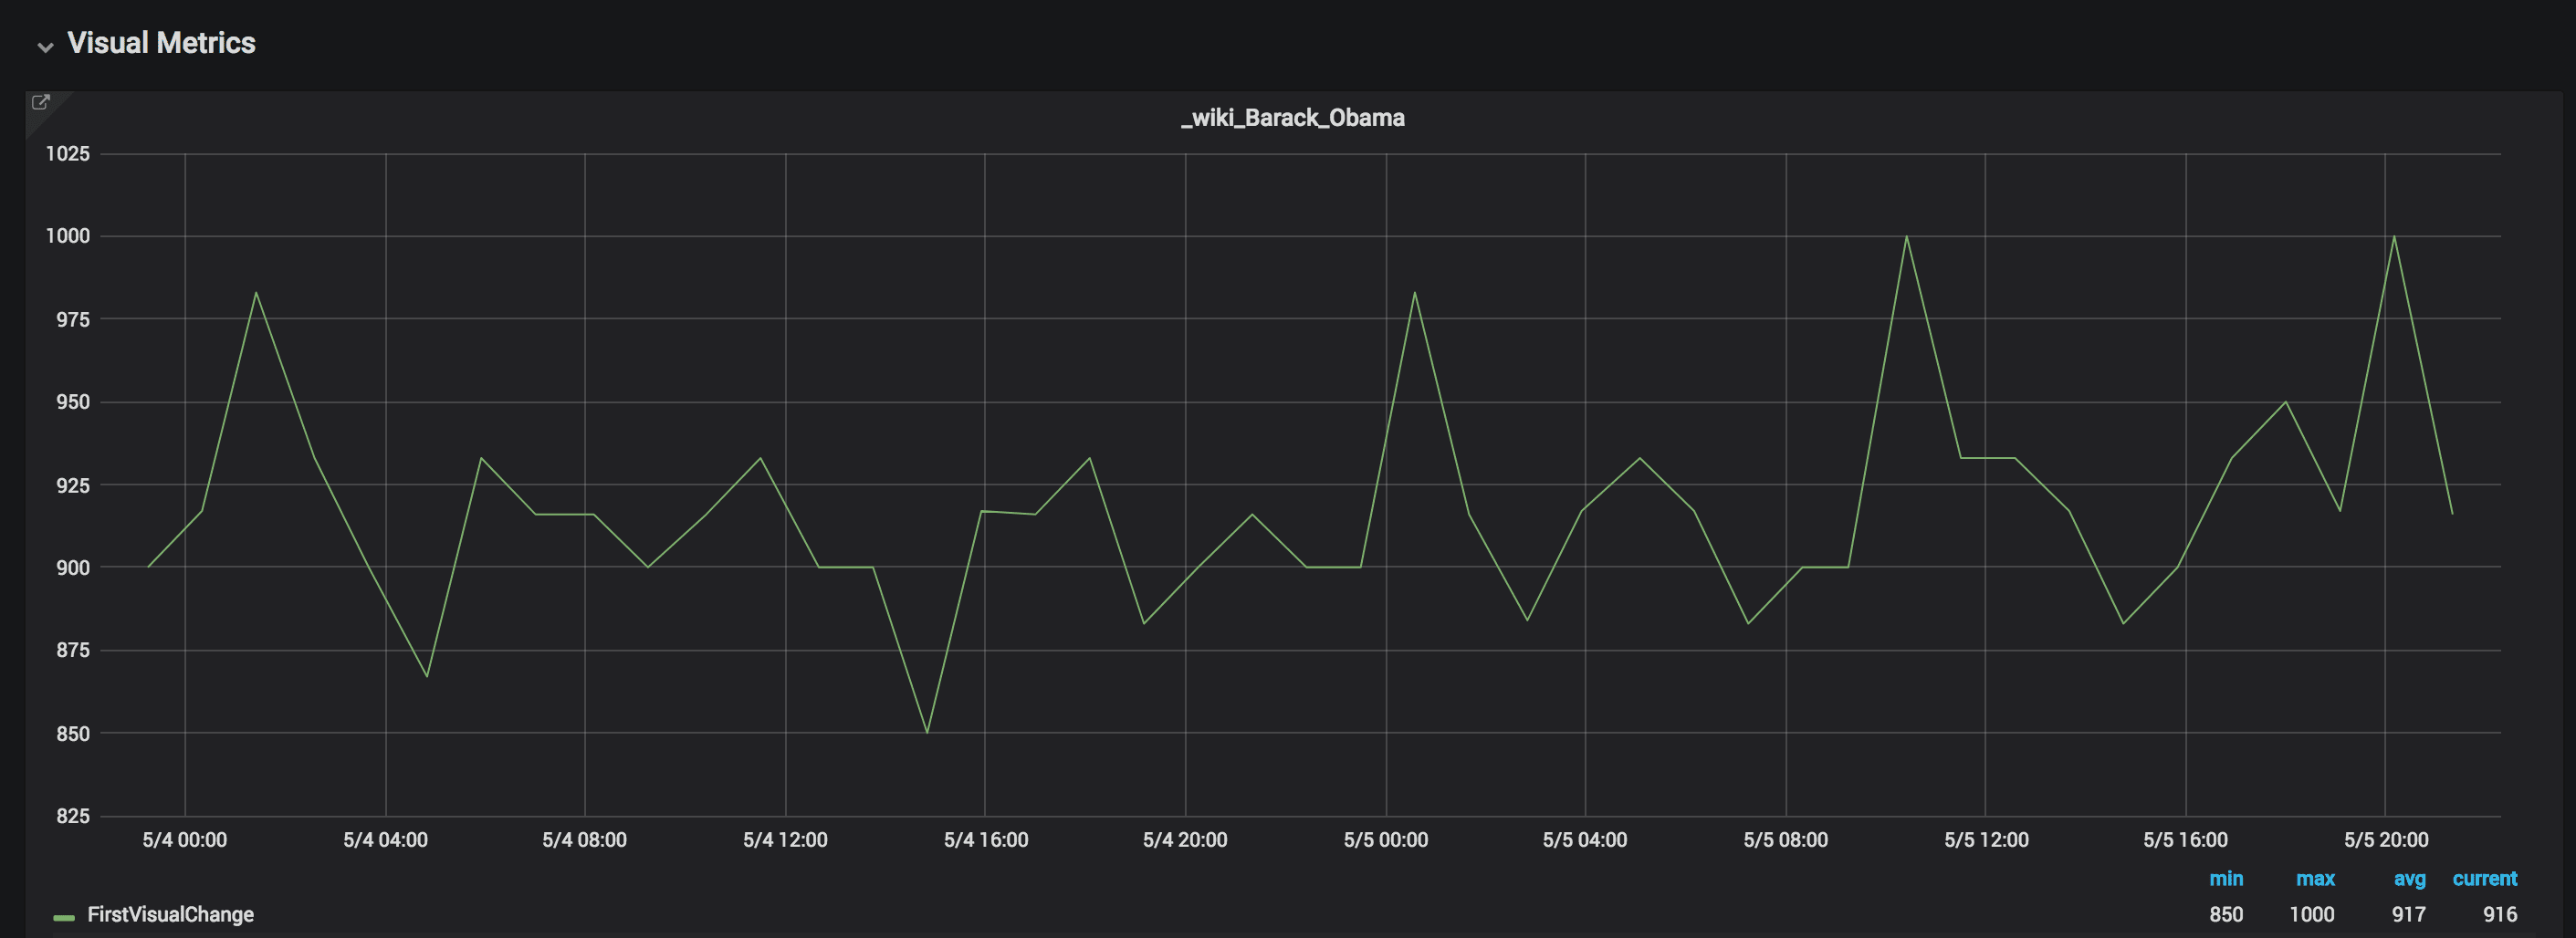
The First Visual Change variation is 150 ms
And then with WebPageReplay:
Using WebPageReplay the variation is 67 ms.
Using WebPageReplay we get more stable metrics. This is super useful if you want to make sure you find front end performance regressions. However testing without a proxy is good since you will then get the same variations as your user will get.
A lot of love for WebPageTest #
We fixed a couple of bugs using WebPageTest and added some extras.
We now display Chrome timing metrics per run #2046, show the WebPageTests id and tester name in the HTML #2047, use WebPageTest screenshot if you don’t run Browsertime #2048, show some Lighthouse summary metrics you use Lighthouse #2049 and show some of those interactive metrics if they exists #2050. We also link directly to each individual run if you use WebPageTest #2045.
Small changes but it makes the WebPageTest HTML report page more usable.
Statsd support #
Omri made a PR (#1994) that adds StatsD support (with bulking)! Thank you Omri for the nice PR!
New S3 plugin #
We upgraded/rewrote the S3 plugin that fixes (all) the problems we have seen with large files failing to upload #2013. Since we upgraded on our test servers we haven’t seen any S3 problems at all.
Console messages from Chrome #
In the new version of Browsertime you can collect console messages from Chrome. Add --chrome.collectConsoleLog to your run and you can see that extra info on the PageXray tab for each individual run. We also send the number of errors to Graphite/InfluxDB by default, making it easy to create alerts on console errors.
Use the same parameters Browsertime/sitespeed.io #
We tried to make CLI parameters the same as with Browsertime, so that you can use the same for both tools (meaning most of the parameters you don’t need to prepend with browsertime. Check sitespeed.io --help
CPU data from Chrome #
We have a new project called Chrome trace built by Tobias that parses the Chrome trace log and check the time spent. Use it by add --chrome.timeline to your run. For a brief period we did use the Trace parser project but moving to our own will open up for us to add more metrics and do bug fixes faster.
If you turn it on, the metrics will automatically be sent to Graphite. Just update your dashboards so you can see it!
Fixes #
InfluxDB event annotations overwrite within test session. Thanks Michael J. Mitchell for the PR #1966.
Sanitize path segments when creating folder (taking care of bad characters when creating new folders) - Thank you Ryan Siddle for the PR! #1961.
If you are a InfluxDB user, your tags now will hold more info (not only category tags). Thank you Icecold777 for the PR #2031.
You can now change safe char for groups/domain in InfluxDB with
--influxdb.groupSeparator. Thank you amic87 for your PR!To collect the Chrome timeline you should now use
--browsertime.chrome.timelineinstead of the old deprecated--browsertime.chrome.collectTracingEventsTo collect Visual Metrics add
--visualMetrics(instead of the old--speedIndex)You can now choose for what kind of content you want to include the response bodies when you use Firefox:
--browsertime.firefox.includeResponseBodieswith the value none, all, html.We finetuned the tabs in the result pages and followed Browsertime and make all output files 1 based instead of 0. The first run will now have files named with 1. Yep as it should :)
Breaking changes for plugin makers #
For plugin makers or plugin users that uses screenshots or Chrome trace logs there are a couple of changes:
- The screenshot is not passed as messages anymore to decrease the memory impact. If you need them, you need to get them from disk instead of the queue.
- The Chrome trace log is not passed as messages anymore to decrease the memory impact by default. Add
--postChromeTraceto pass around the Chrome trace to other plugins.
What’s next #
The coming weeks/month we going to take care of bugs, concentrate on making a better guide to deploy sitespeed.io and then it’s time for summer vacation :)
Checkout the full Changelog for all changes.
/Peter