Browsertime 3.0
We have built 3.0 mainly for ourselves: The old version (2.x) was built with Promises. Promises were good compared to the old callback hell, but moving to async/await was essential for us to be able to move fast: fix bugs and add more functionality. In the new version the main workflow is built with async/await it will help us a lot in the future.
But why should you upgrade? We also added a couple of fixes/new functionality:
- Less memory usage/less CPU usage = more stable metrics
- New Firefox with new way of getting the HAR
- CPU time spent from Chrome
- New way of navigate (more stable metrics)
- WebPageReplay support using Docker
- Screenshots as jpeg or png
- 1 based file names
- Better error handling
- DOMContentLoaded in the video
- Trace files/logs are now gzipped
- Shorter(!) videos
- Emulating mobile in Chrome works better than ever
- Introducing a new metric: Visual Readiness
- Do you need that extra MOZ HTTP log?
- Better friends with Android
- And more …
- Breaking Changes
Less memory usage/less CPU usage = more stable metrics #
In the new version we store metrics and data to disk between runs. That means screenshots/ tracelogs and other metrics are stored to disk immediately. This makes Browsertime use less memory when you do many runs. See #308 for a use case where that helps.
The CPU usage is also decreased, mainly since we switched to the new version of Firefox. Here’s an example of when we deployed an early version of 3.0 on AWS.
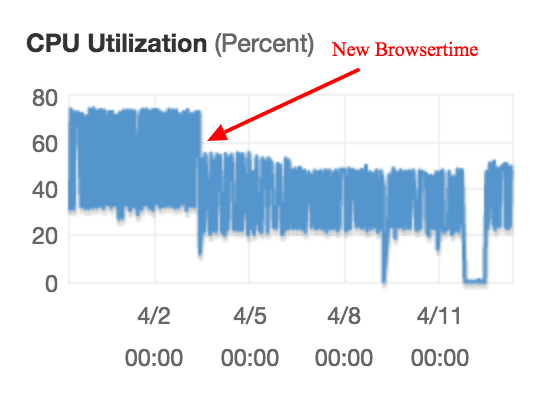
The red arrow shows when we installed the first alpha version of Browsertime
The decreased memory and CPU usage makes your metrics more stable.
New Firefox with new way of getting the HAR #
You know the HAR Export trigger was broken in Firefox 55. The only alternative is to use the HTTP MOZ log to recreate a HAR but that will add overhead that for some sites at least makes the timing metrics unrealistic.
We now use the new HARExport Trigger that will work in Firefox 60/61. If you use FF versions lower than 61 it will add some overhead. And at the moment the devtools bar needs to be open, but that will hopefully be fixed in later version of Firefox.
CPU time spent from Chrome #
We have a new project called Chrome trace built by Tobias that parses the Chrome trace log and check the time spent. Use it by add --chrome.timeline to your run. For a brief period we did use the Trace parser project but moving to our own will open up for us to add more metrics and do bug fixes faster.
New way of navigate (more stable metrics) #
In the old version of Browsertime we used the Webdriver to navigate to the page. In some cases on under powered server that could make metrics unstable. We now navigate with JavaScript and that has made our metrics more stable.
We now use pageLoadStrategy none. That means if you run your own pageCompleteCheck you can end your test whenever you want (before onLoad if you want).
WebPageReplay support using Docker #
We had it in alpha/beta for a while and now it’s there in our default container: WebPageReplay.
WebPageReplay is proxy that first records your web site and then replay it locally. That can help you find performance regression in the front-end code easier: Latency/server timings are constant.
You can run like this: docker run --cap-add=NET_ADMIN --shm-size=1g --rm -v "$(pwd)":/browsertime -e REPLAY=true -e LATENCY=100 sitespeedio/browsertime https://en.wikipedia.org/wiki/Barack_Obama
Here are a couple of examples from our real world tests. We test on Digital Ocean Optimized Droplets 4 gb memory with 2 vCPUs. We test both with connectivity set to cable (to try to minimize the impact of flaky internet) and one tests using WebPageReplay. We tests with the same amount of runs on the same machine.
Here’s an example from one of the sites we test. Here we test with connectivity set to cable. 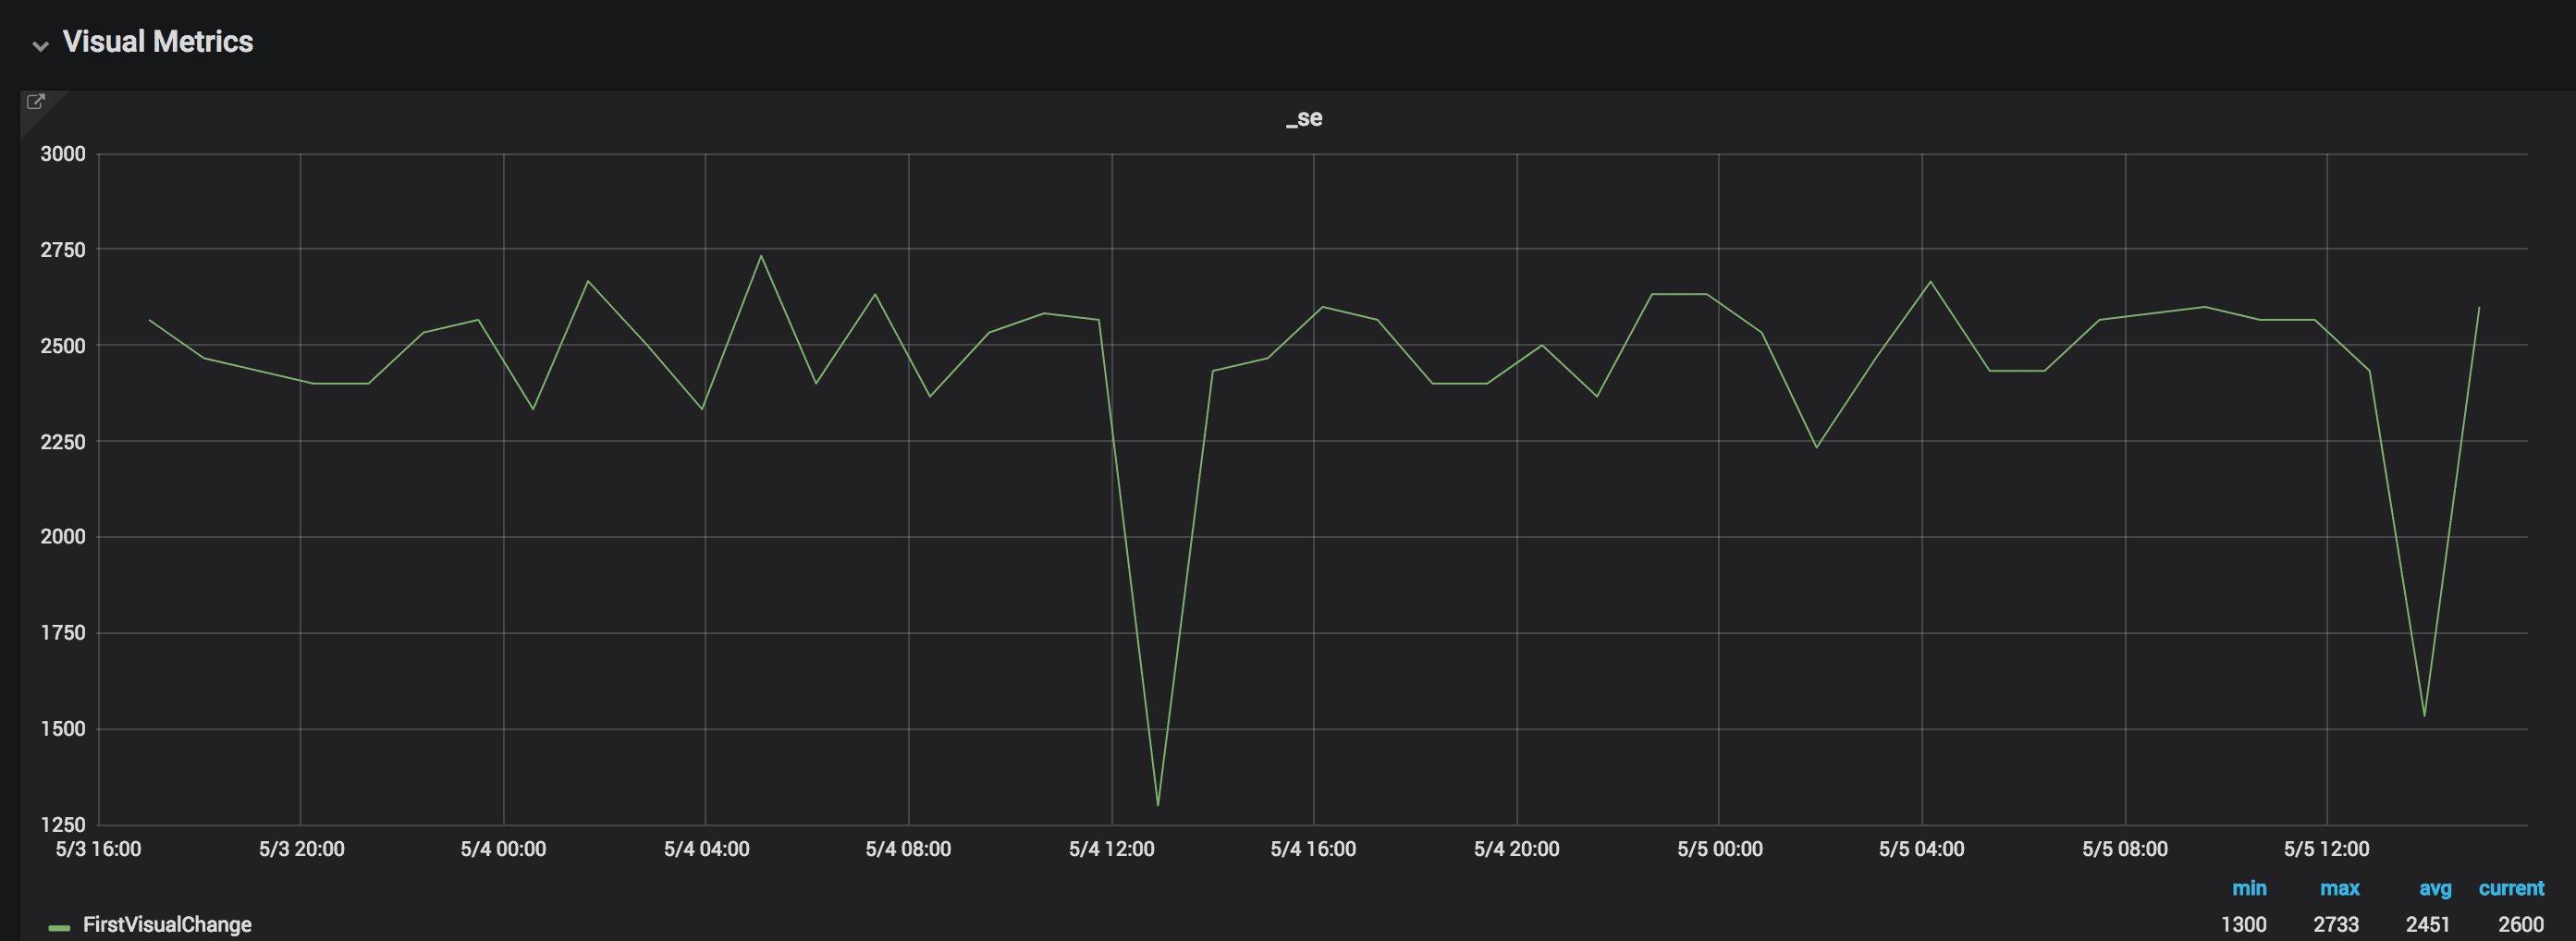
The variation is normally whopping 500 ms and max is over 1400 ms.
The same site using WebPageReplay, the same amount of runs:
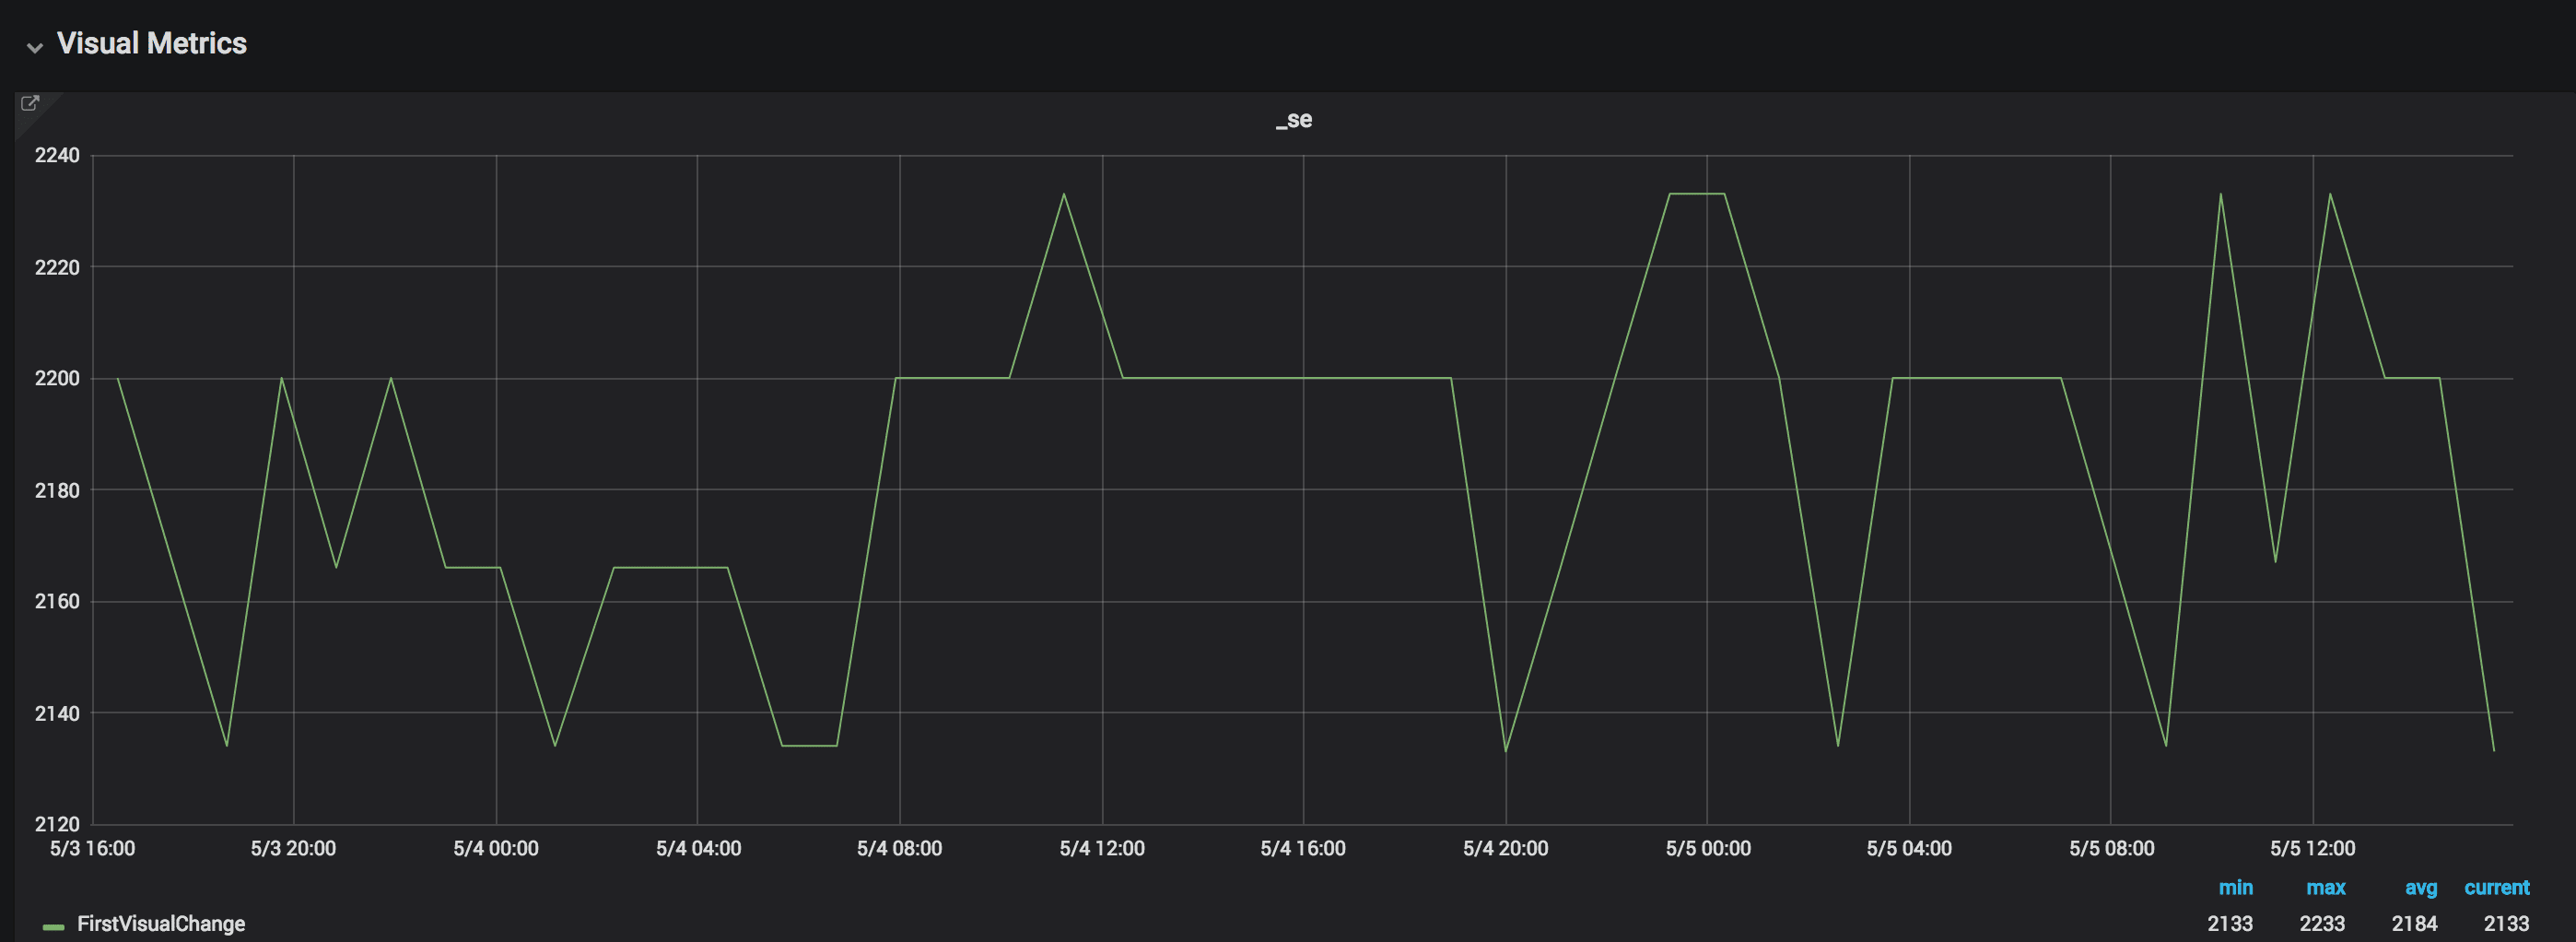
The difference is now less than 100 ms.
Here’s another site, setting connectivity:
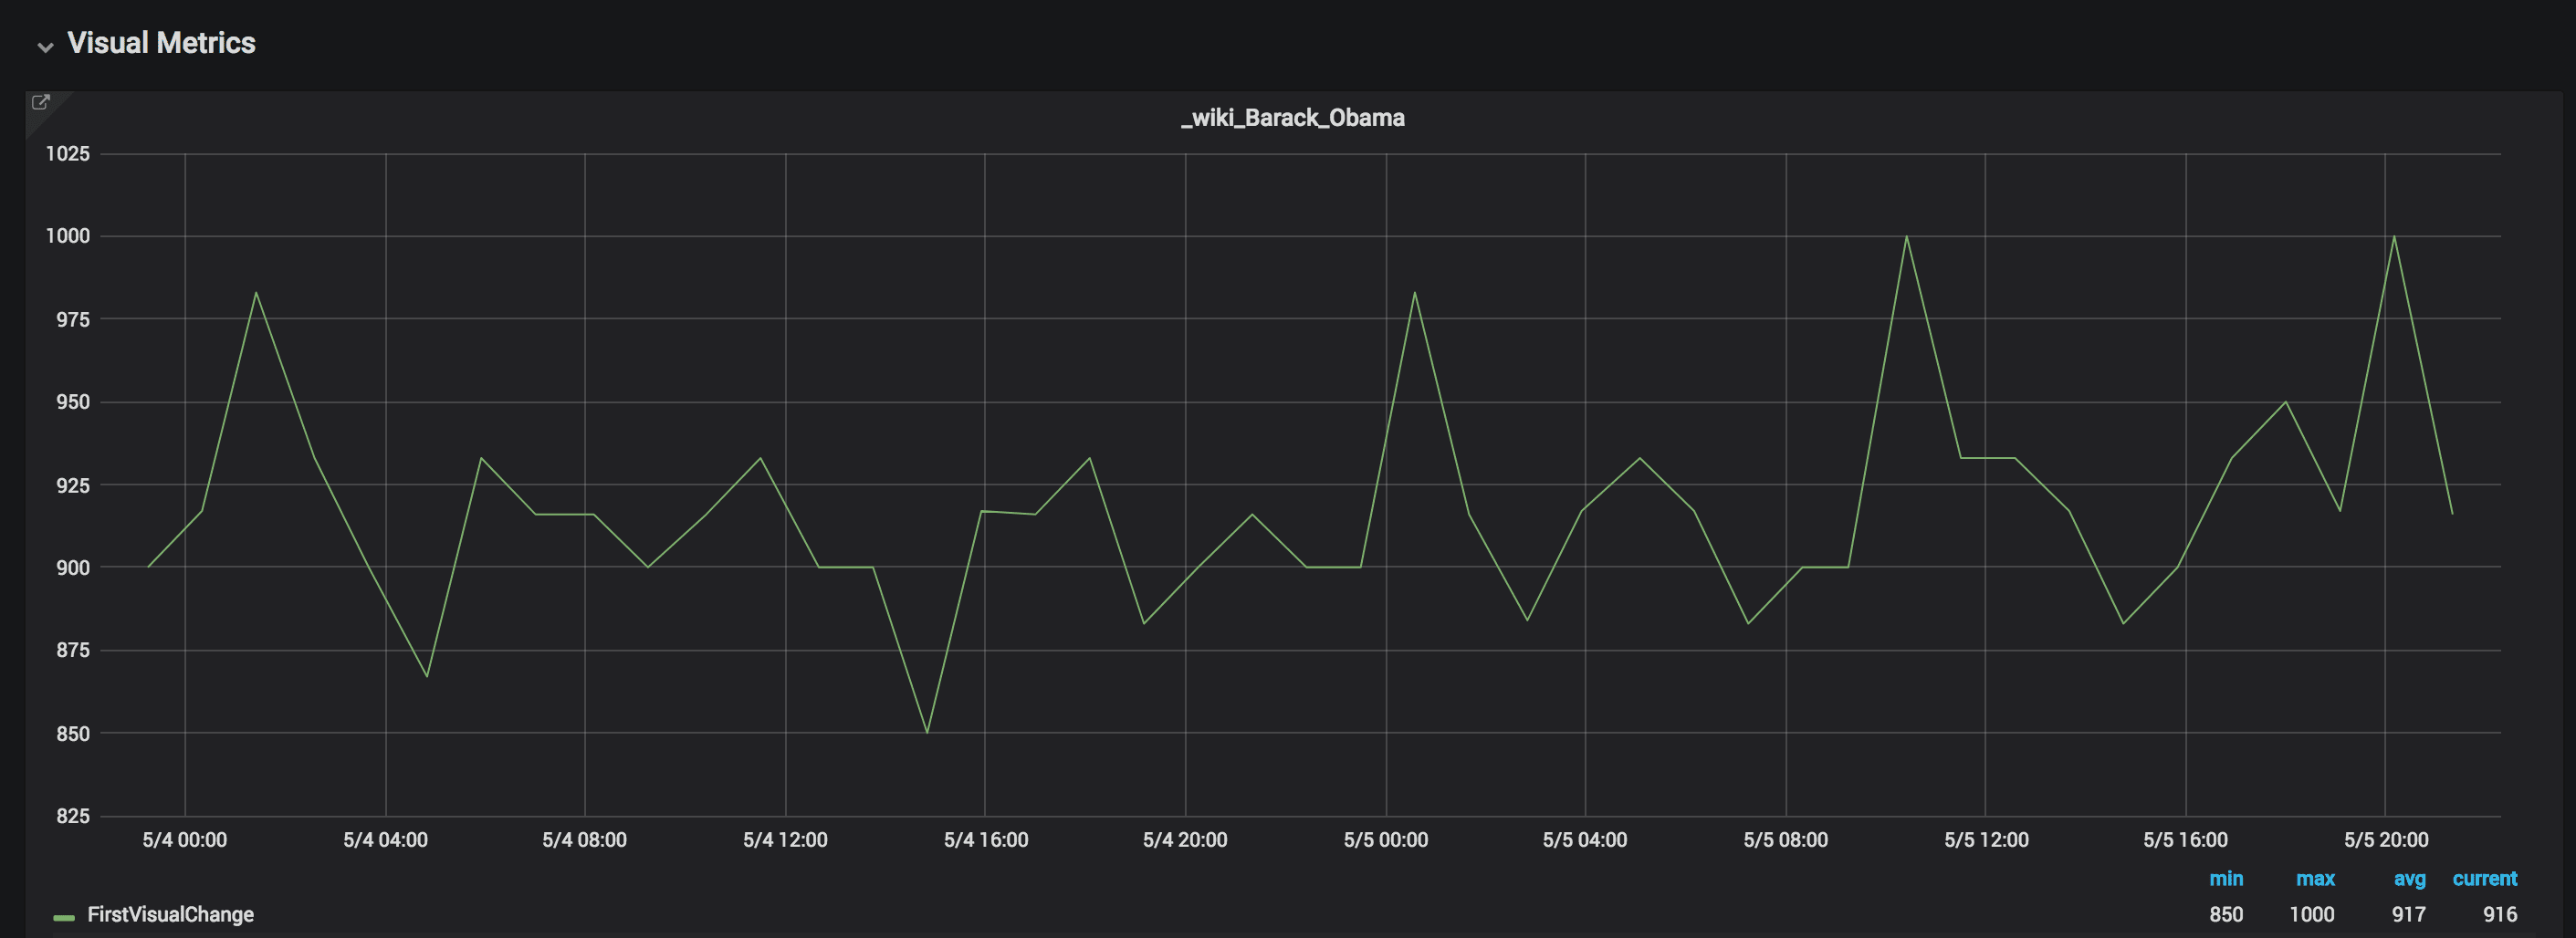
The First Visual Change variation is 150 ms
And then with WebPageReplay:
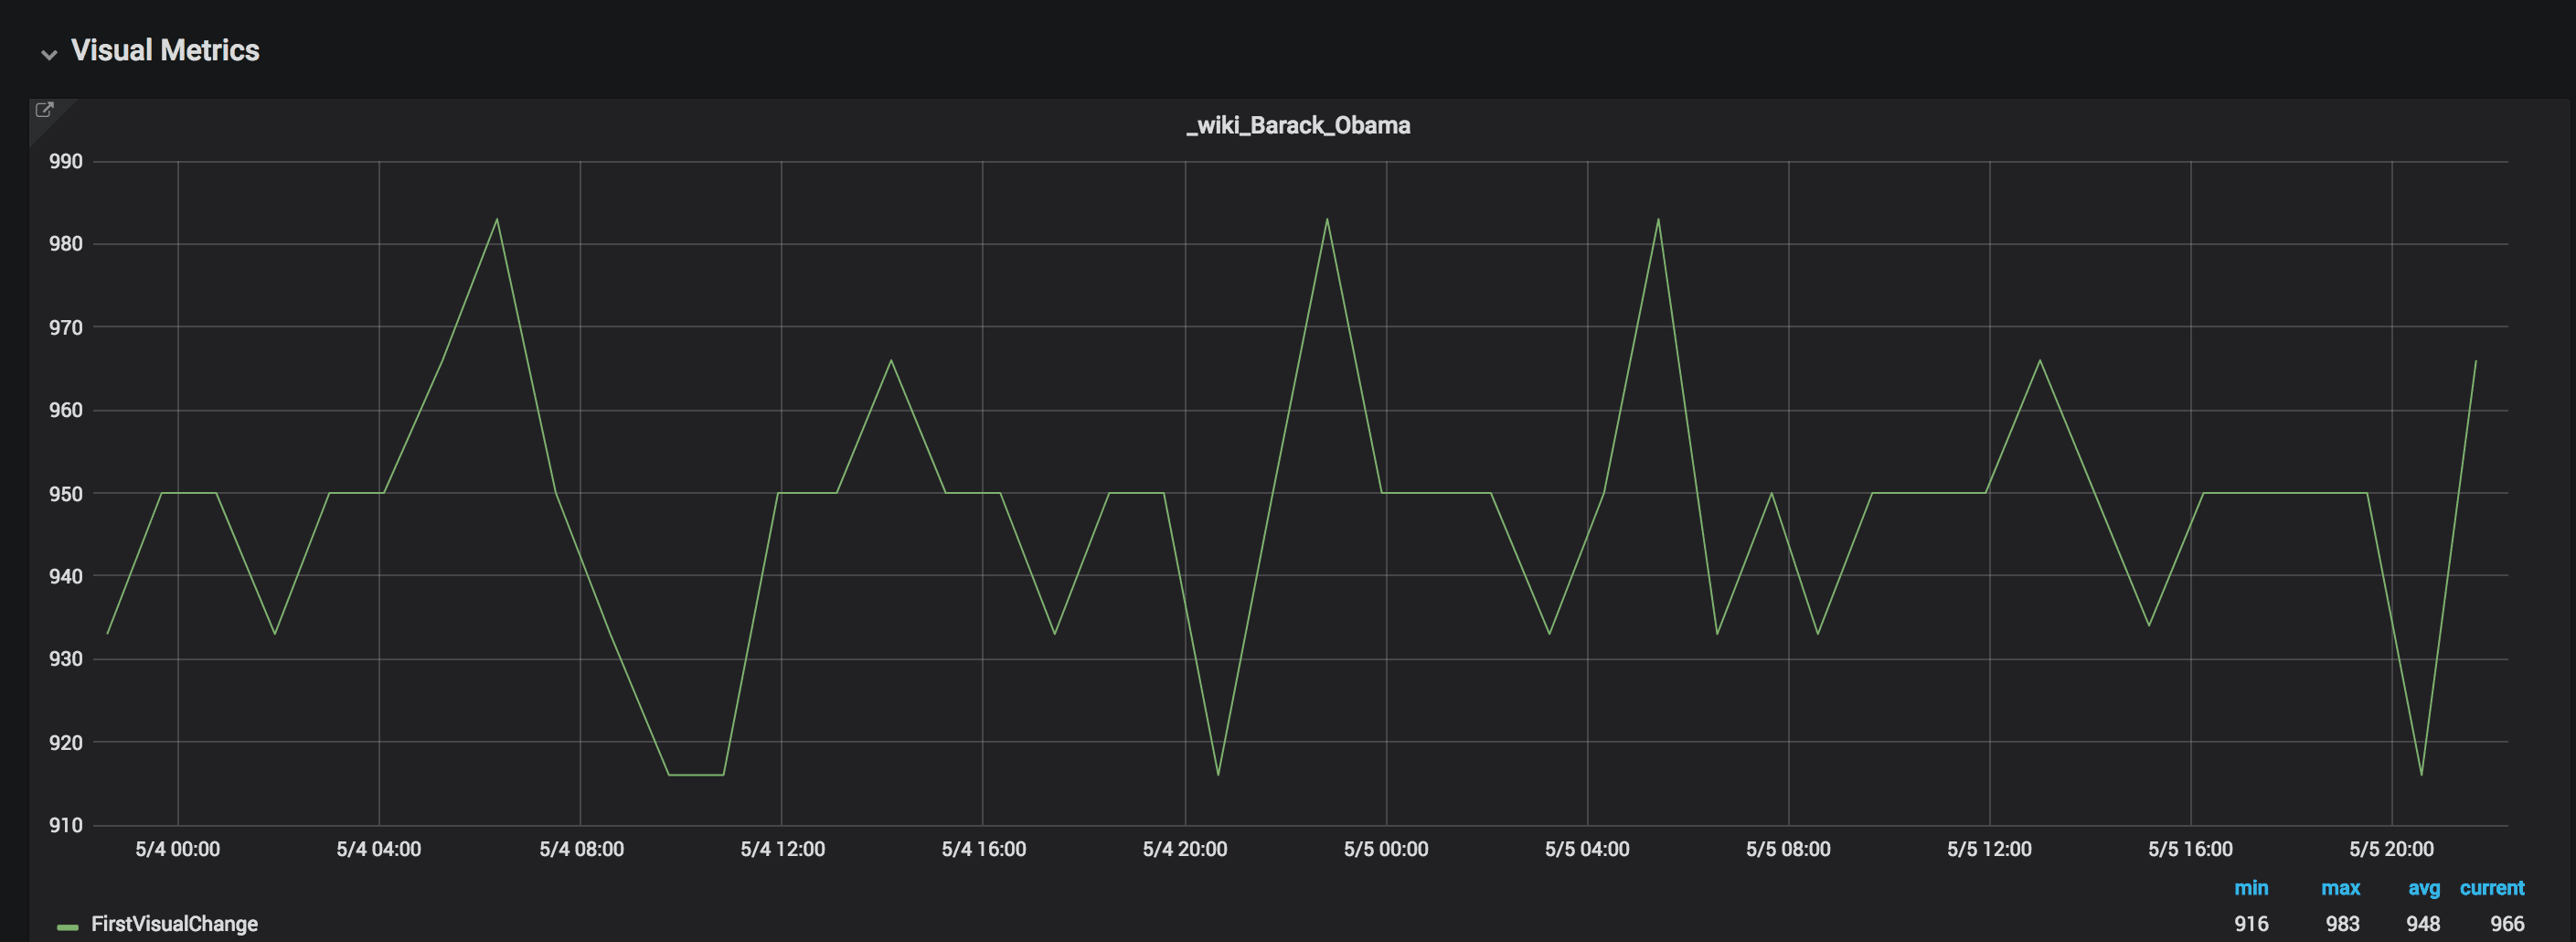
Using WebPageReplay the variation is 67 ms.
Using WebPageReplay we get more stable metrics. This is super useful if you want to make sure you find front end performance regressions. However testing without a proxy is good since you will then get the same variations as your user will get.
Screenshots as jpeg or png #
We use sharp to store/convert screenshots. Screenshots are now located in the screenshots folder, named after each run. Default is jpeg screenshots. #468.
1 based file names #
One of the most annoying things in older Browsertime versions has been that the file names has been 0-based. File names are now based on 1 and not 0 so the first file from the first iteration is named something with -1. #536.
Better error handling #
Browsertime now catch most errors and there’s an error array in the JSON output that holds errors that has happened within each run. The array is an array of arrays, potentially you could have multiple errors per run.
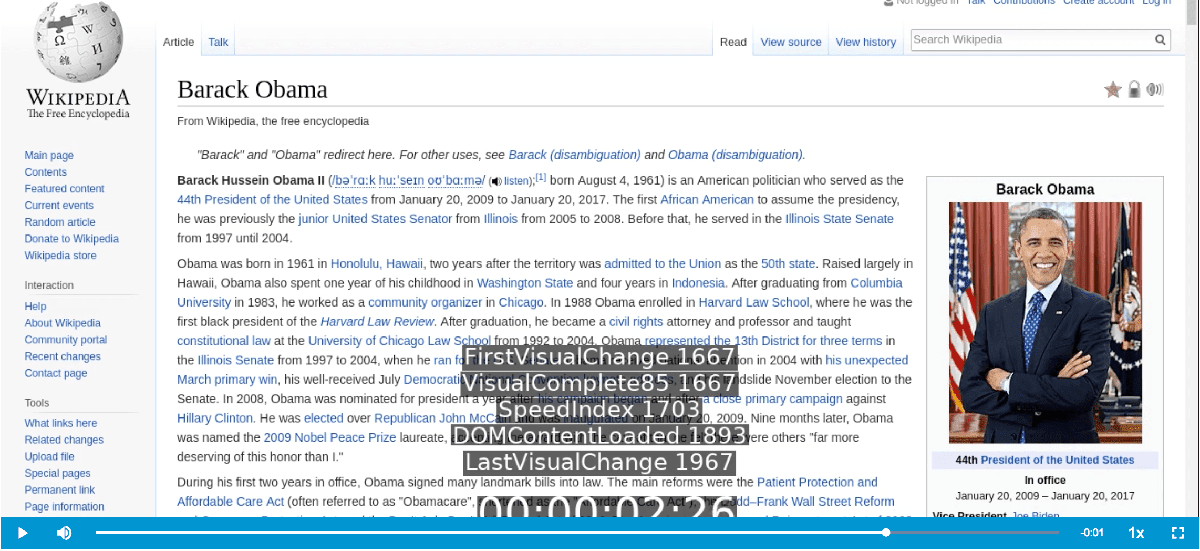
DOMContentLoaded in the video #
You can now see when DOMContentLoaded happens in the video.
Trace files/logs are now gzipped #
We try to stora all large files and gzipped from the new version. You can also gzip the HAR file by adding --gzipHar to your run.
Shorter(!) videos #
Move video out of pre/post scripts. When we first started with the video we used the pre/post structure. That was ok to move fast but one of the negatives is that stopping the video happen after we collected all metrics. We now stop the video exactly when the page is finished loading #448.
Emulating mobile in Chrome works better than ever #
Better handling of Chrome emulated mobile: We now set the correct window size for phones #528.
Introducing a new metric: Visual Readiness #
We got a new metric: Visual Readiness - the time between the first change on the screen until the last one. You will get it with the rest of the Visual Metrics by turning on --visualMetrics
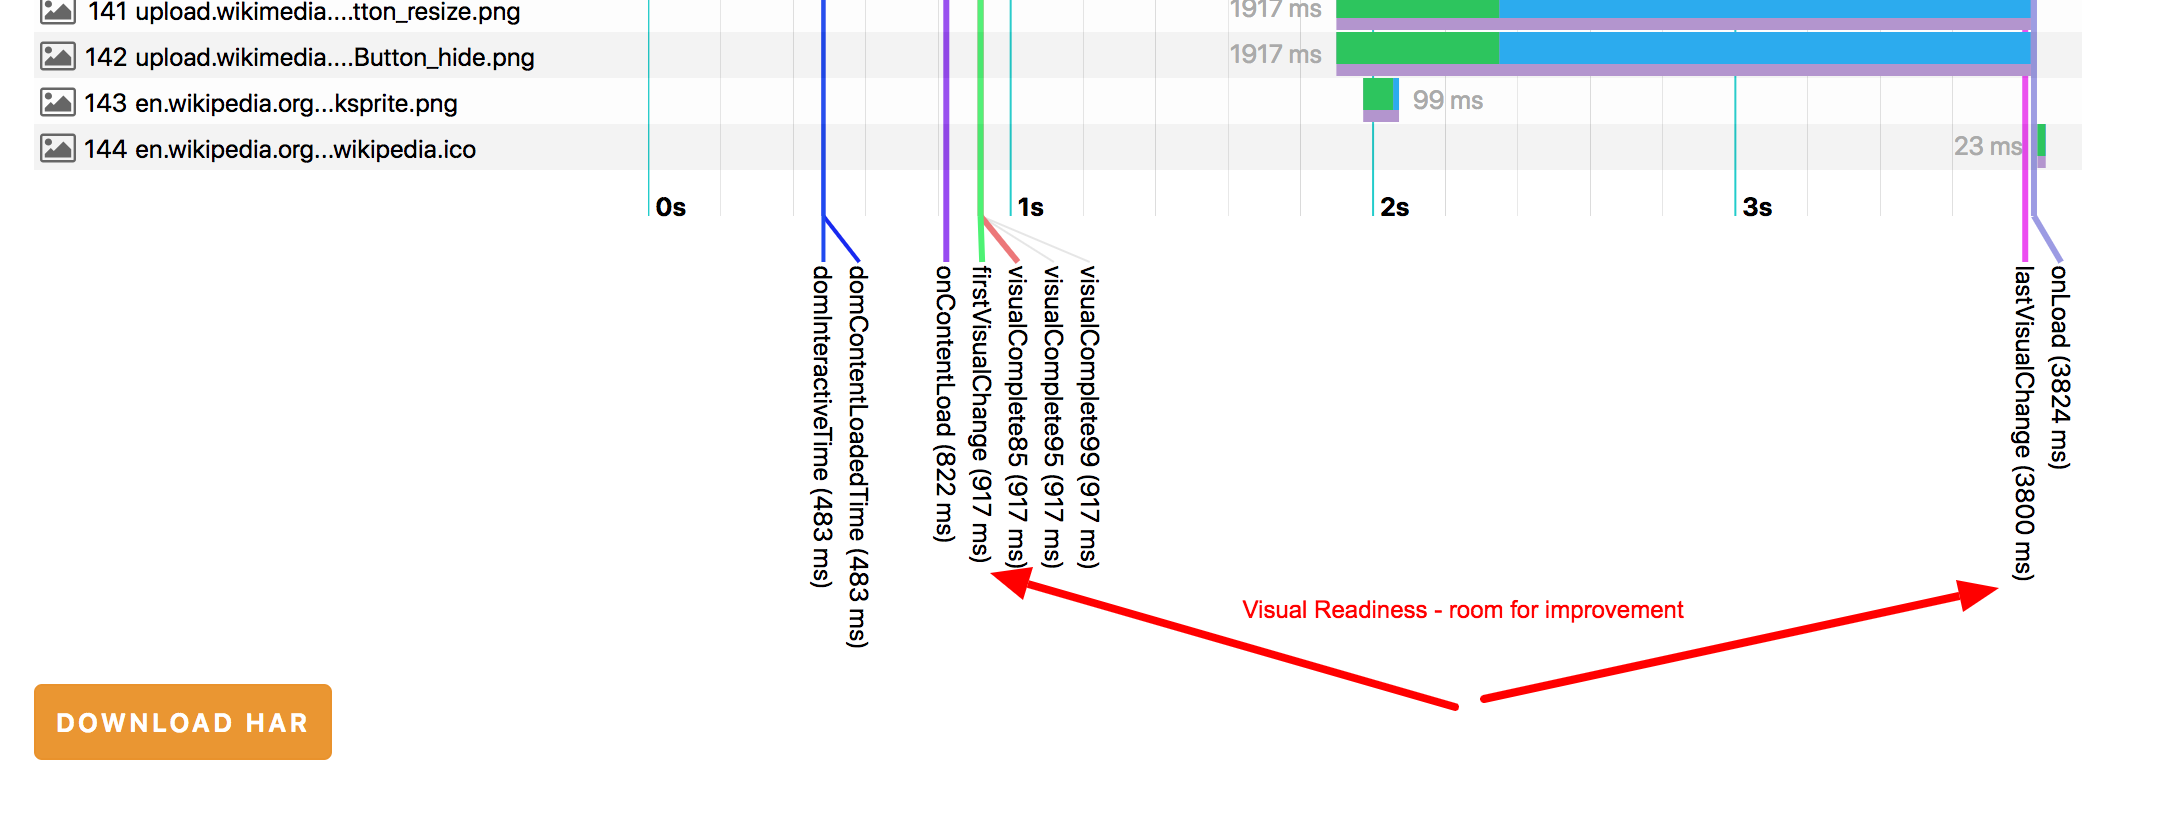
Lower Visual Readiness is better.
Do you need that extra MOZ HTTP log? #
Sometimes when you want to report a bug to Firefox you need to supply the MOZ HTTP log to make it easier for Mozilla to debug the issue. You can now turn on the MOZ HTTP log for Firefox with --firefox.collectMozLog #451 see https://developer.mozilla.org/en-US/docs/Mozilla/Debugging/HTTP_logging.
Better friends with Android #
We updated how Browsertime drives Chrome on Android and it works better than before. Try it out and let us know if there is something that needs to be fixed.
And more … #
Checkout the full Changelog for all changes.
Breaking Changes #
We got some breaking changes, please read about them before you upgrade.
- Since we updated to Firefox Quantum (and the new HAR Export trigger) timing metrics will change for you. Quantum is faster/slower for your site.
- Store extra JSON and screenshots per run (and collect stats between runs). We want to make Browsertime as mean and clean as possible: Store all extra JSONs (chrome trace categories, console log and more), and the screenshots between runs (before they where stored on exit). This is good because it will decrease the memory impact but it is non-backward compatible change! Sitespeed.io and other tools need to change how they handle extra JSONs and the screenshot. Browsertime users that use browsertime from the command line will not see any change. We also moved most stats to be collected between runs, that is needed for CPU stats since we store the data and throws it away between runs #449.
- We disabled the old HAR Export trigger (max Firefox 54). And we now uses the new https://github.com/devtools-html/har-export-trigger/ that needs Firefox 61 or later to work.
- We renamed the options to get Visual Metrics to be
--visualMetricsinstead of –speedIndex. When we first introduced Visual Metrics Speed Index was more known, but it has always been a thorn in the side to call the option that. In Docker we collect Visual Metrics by default. - We use sharp to store/convert screenshots. Screenshots are now located in the screenshots folder, named after each run. Default are now jpg screenshots. #468. Before it was png.
- Remove deprecated (renamed) options experimental.dumpChromePerflog (use chrome.collectPerfLog) and chrome.dumpTraceCategoriesLog (use
--chrome.collectTracingEvents). - Remove broken support for video recording on macOS (Docker on Mac still works).
- Removed deprecated (renamed) option videoRaw. Always use
--videoParams.addTimer(boolean) if you want to toggle timer/metrics in the video - We now use pageLoadStrategy none. That means if you run your own pageCompleteCheck you can now end your test whenever you want (before onLoad if you want) #501.
- We changed how we change between orange to white when we record a video. Depending on your machine, Selenium/WebDriver introduced latency the old way we did the switch #503.
- We removed collecting Resource Timing data as default #505. If you still need the metrics, you can still run the script: https://github.com/sitespeedio/browsertime/blob/2.x/browserscripts/timings/resourceTimings.js.
- You can now choose what kind of response bodies you want to store in your HAR file. Instead of using –firefox.includeResponseBodies to include all bodies you can now use
--firefox.includeResponseBodies[none,all,html]#518. - We cleaned up how you collect trace logs from Chrome. If you want the devtools.timeline log (and CPU spent metrics), just use
--chrome.timeline. If you want to configure trace categories yourself, use –chrome.traceCategories - File names are now based on 1 and not 0 so the first file from the first iteration is named something with -1. #536.
- Store the ChromeDriver log in the result directory (before it was stored where you run Browsertime) #452.
- In some cases we leaked Bluebird promises, they are now native promises.
- Running the engine took a promise that eventually became the scripts. Now you need to run with the scripts directly (no promises) to simplify the flow.
And by the way: the main branch of sitespeed.io is using 3.0 and we plan to release the next major of in a month or so.