sitespeed.io 14.0 and Browsertime 9.0

Let us celebrate over 10 million downloads of the sitespeed.io Docker container and release sitespeed.io 14 and Browsertime 9!
There are five important new things in the new release:
- New updated Grafana dashboards with all the goodies from Grafana 7.0. All Graphite dashboards is updated: sitespeed.io dashboards, WebPageTest and our plus-1 dashboard.
- You can now see all screenshots for a run in sitespeed.io! This is super useful when you use scripting to test a user journey. You can take screenshots whenever you need and see the result on the result page, making it even easier then before to know what’s going on.
- We have a new section in the documentation: web performance testing in practice focusing in synthetic testing! I’ve think this is the most comprehensive guide to synthetic testing that’s out there.
- You can support us at Open Collective! We need money to be able to run our test servers, run tests on mobile devices and use a dedicated bare metal server. Helping us with that will make sure we continue to release a bug free, feature rich Open Source tool!
- You can get CrUx data direct from sitespeed.io (avoid using the +1 container) with the new crux-plugin.
New dashboards #
All the Graphite dashboards have been updated. There are four focused dashboards for sitespeed.io data:
- The page timings summary - the dashboard focus on timing metrics for a tested page.
- The page summary dashboard shows metrics for a specific page. The dashboard focus on how your page was built and here you can see Coach score, AXE and other data.
- The site summary dashboard show metrics for a site (a summary of all URLs tested for that domain).
- The leaderboard dashboard helps you compare different pages and web sites.
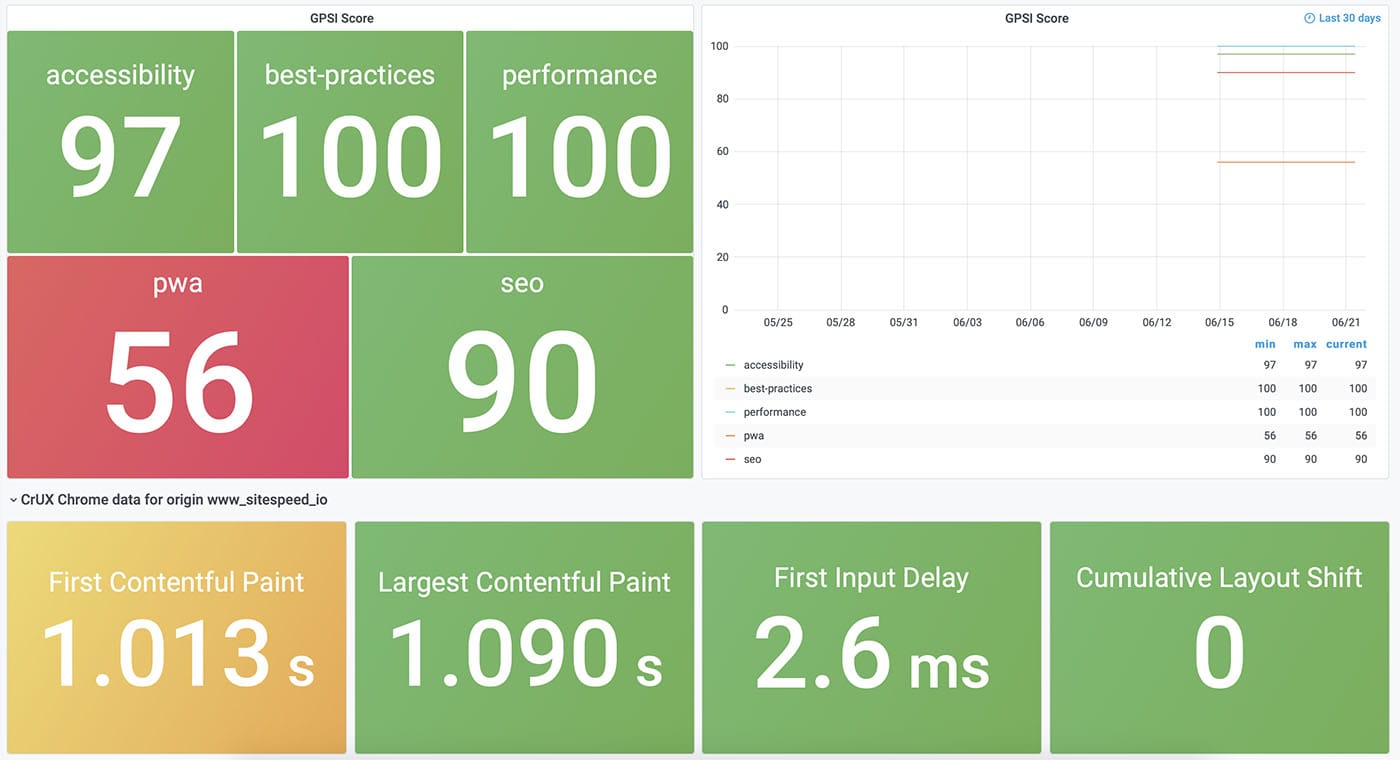
We also have a new and fresh version of the plus 1 dashboard showing GPSI/CrUx/Lighthouse metrics. And the WebPageTest dashboards also got updated!
Lets look at some of the dashboards.
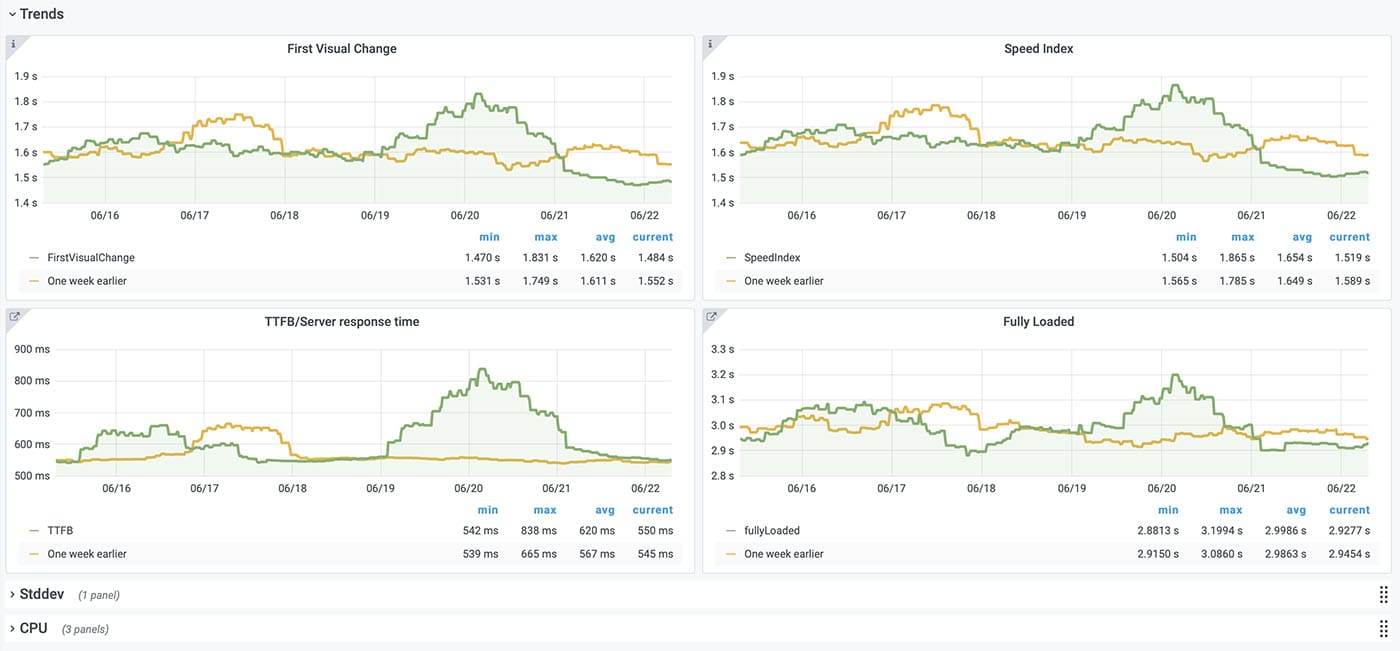
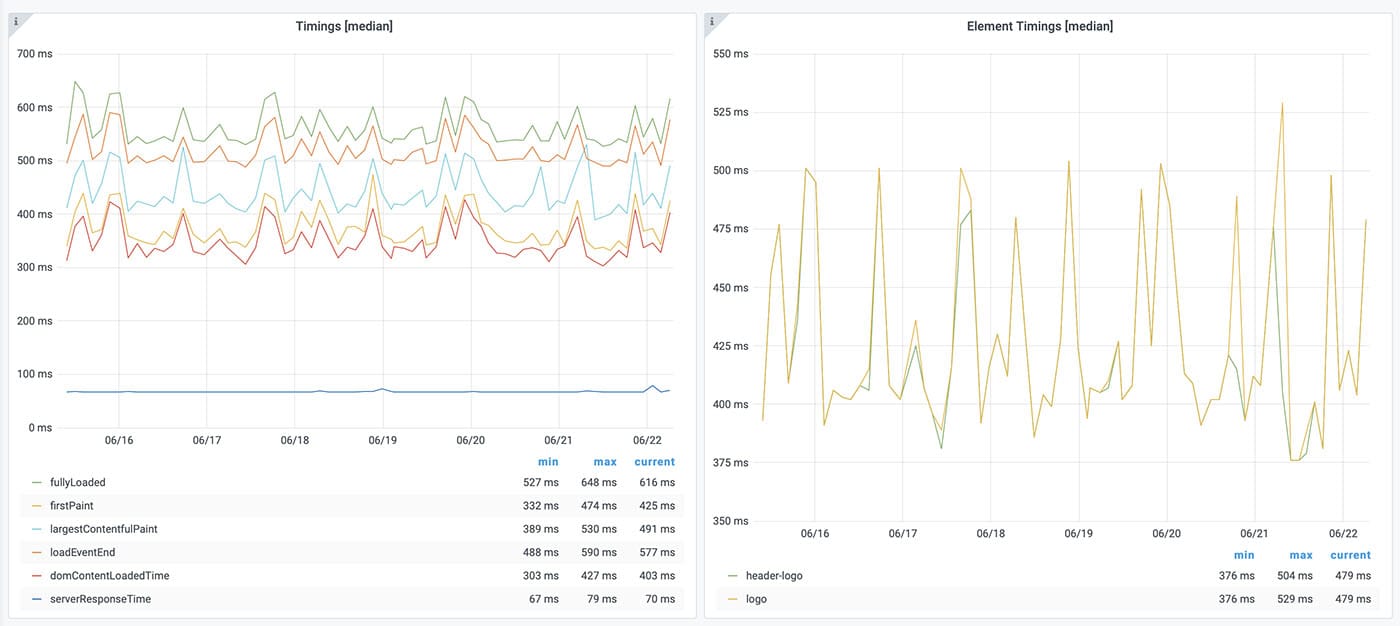
The page timings summary focus on timing metrics and is the number one dashboard you should use when you look for visual regressions. It also show all other timing metrics that is collected.
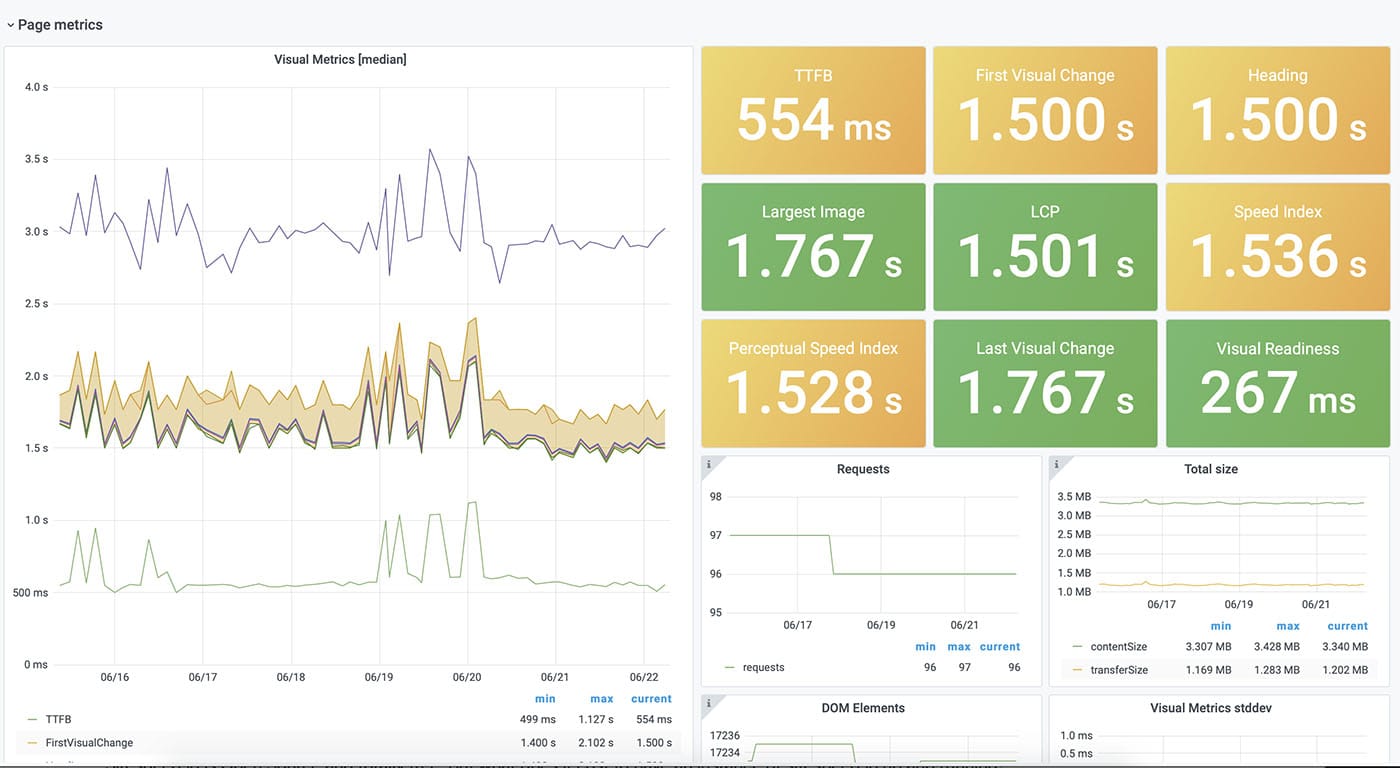
And compare the metrics with last weeks metrics.
You will also see navigation timing, element timing and user timings.
The page summary shows metrics for a specific URL/page. The dashboard focus on how your page was built. The red/yellow/green limits are configurable in Grafana.
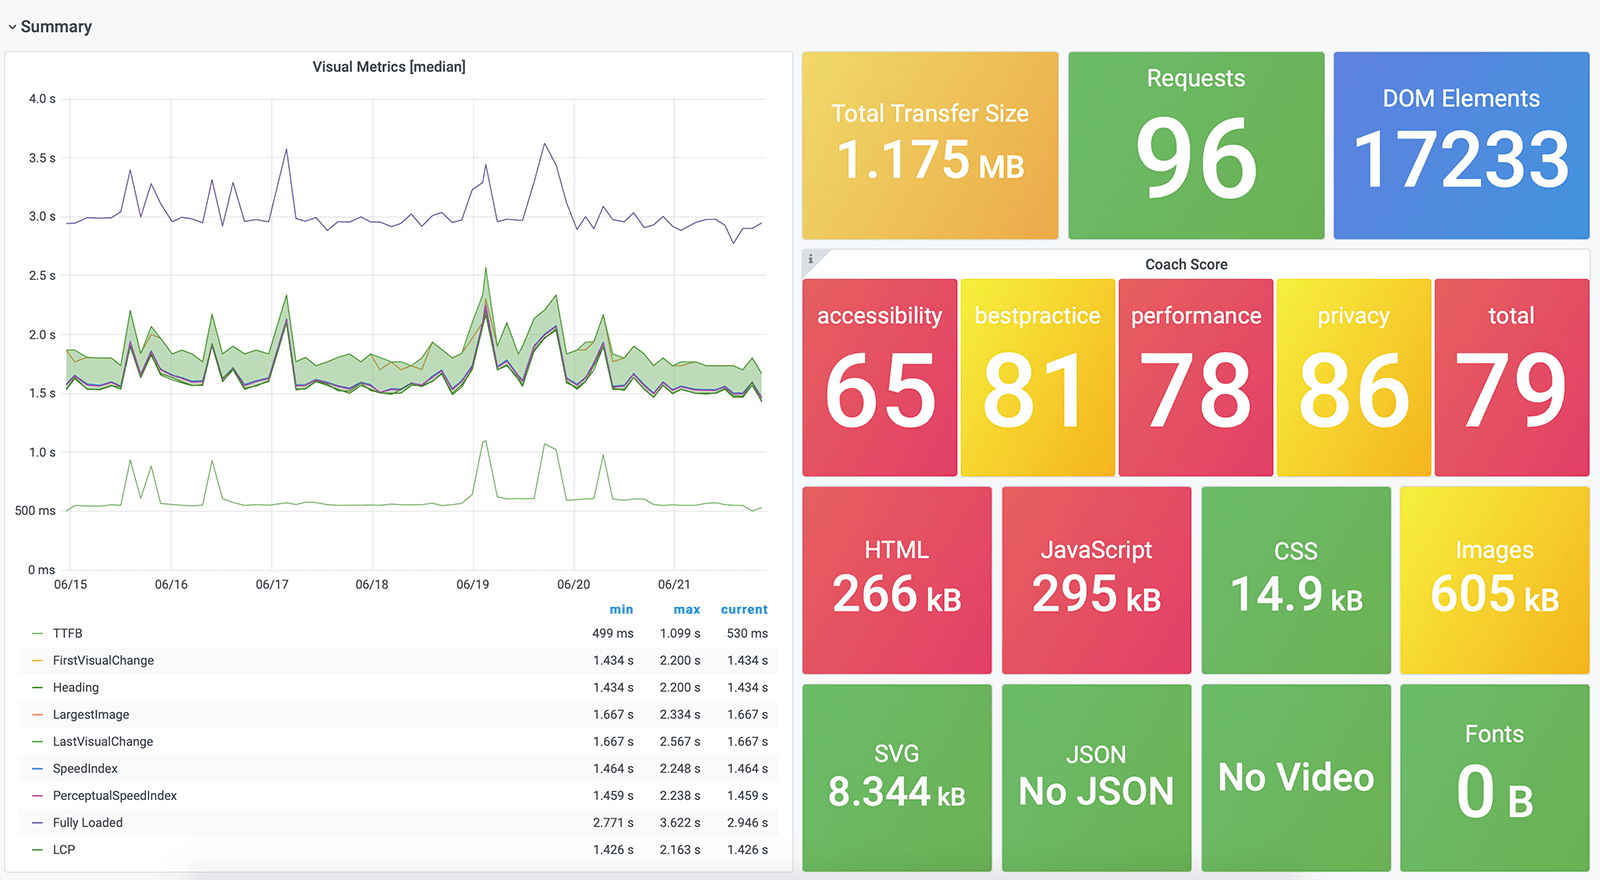
You can also see CPU performance, third party tools and more.
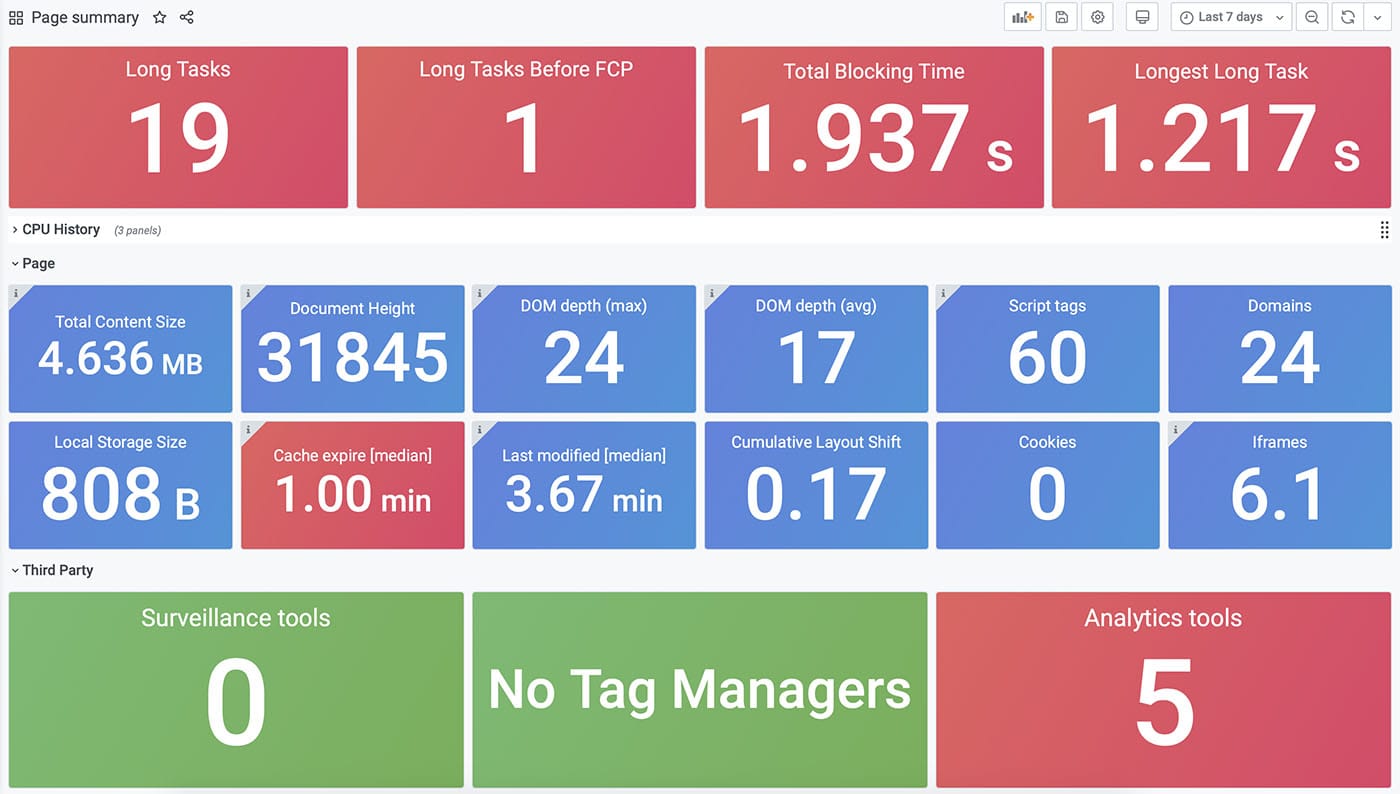
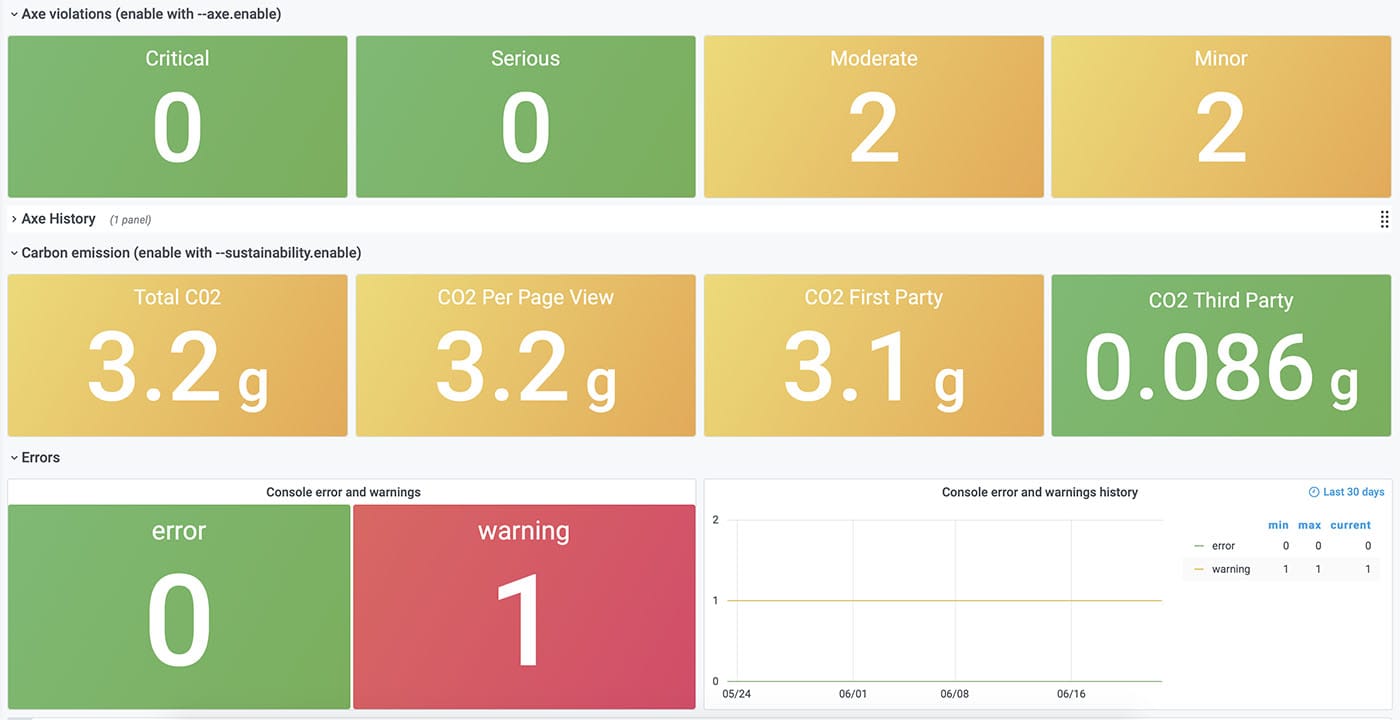
And AXE, CO2 and errors (and a lot more).
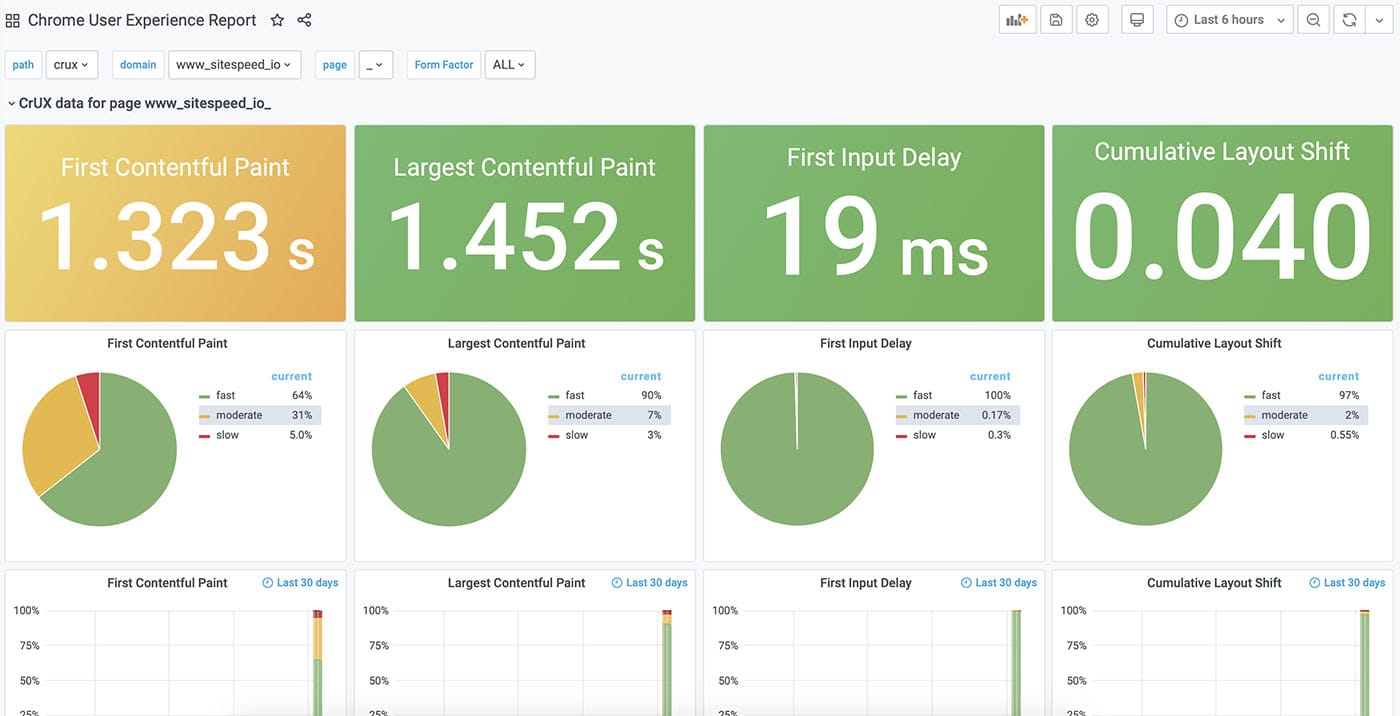
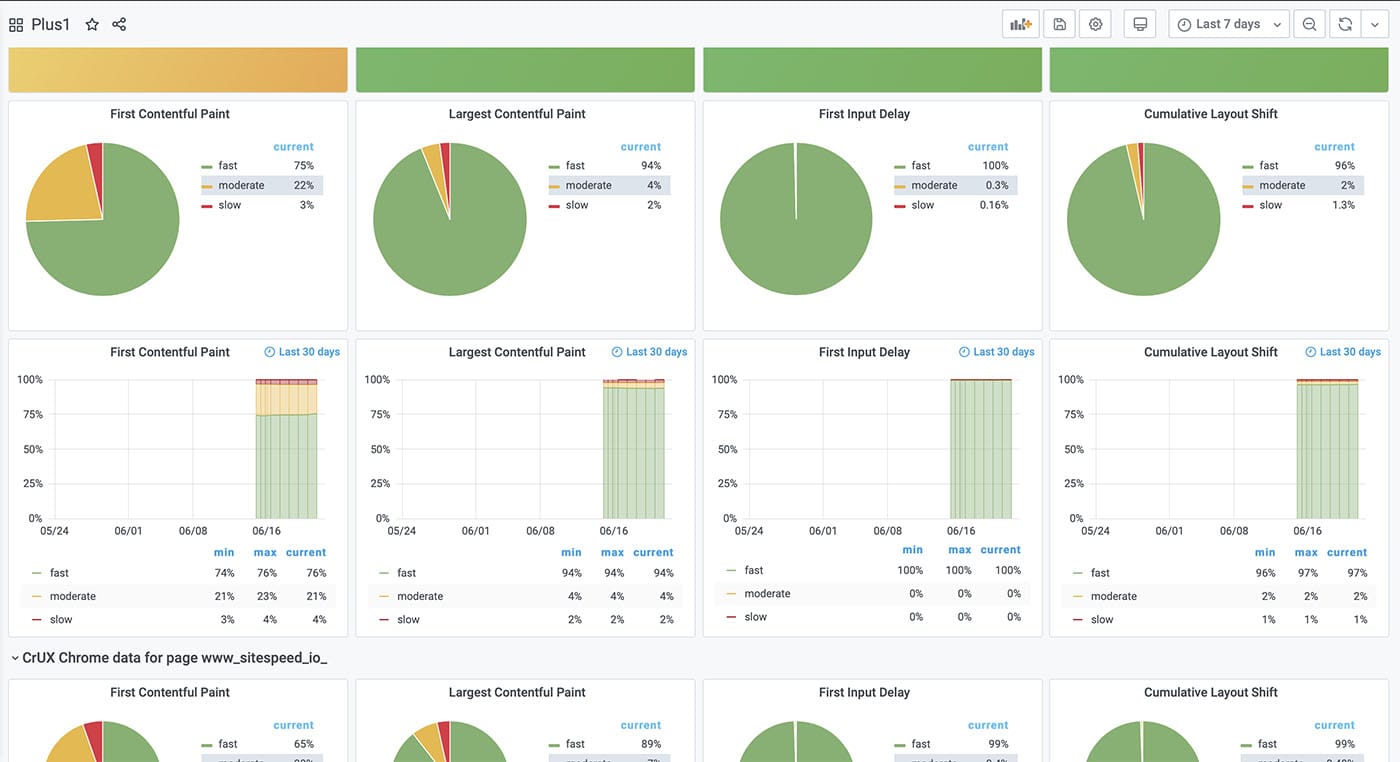
We also added a new dashboard for your sites data from the Chrome User Experience Report plugin.
And if you use the +1 container running Google stuff you can graph Google Page Speed Insights data including CrUx out of the box and it looks like this:
You can read more about the dashboards in the documentation.
Screenshots #
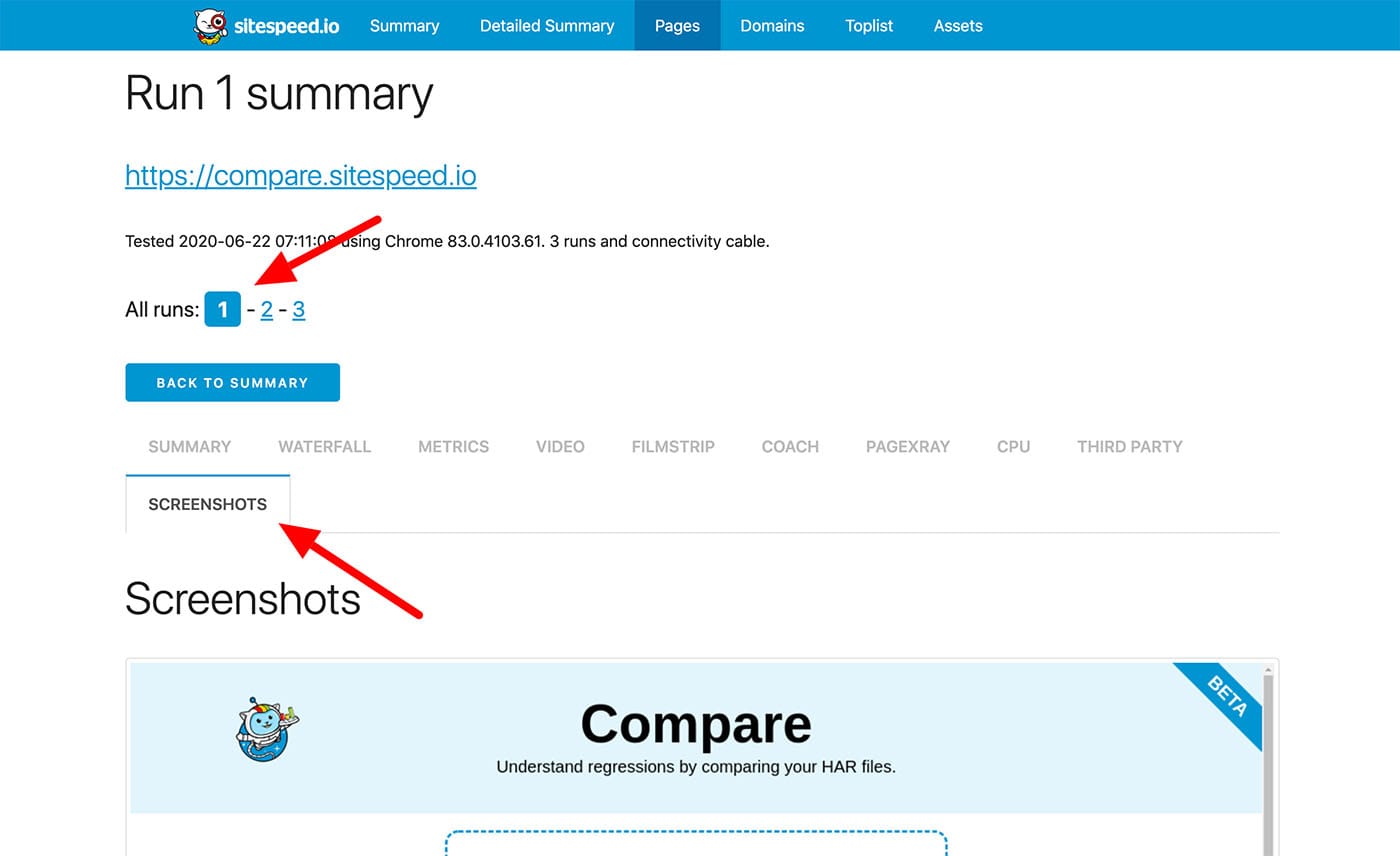
Using scripting you can take screenshots whenever you need. That’s super useful if your script fails because a content change. Take a screenshot when it fails and you can see that in the result. Choose the run and the tab Screenshots.
Documentation for synthetic testing #
There’s a lot of things you need to know when you start run performance test your web page. I’ve been working on documenting what I’ve learned through the years and finally it’s ready! Read all about web performance in practice.
Support sitespeed.io #
We’ve been running sitespeed.io for eight years without financial support. Instead we used host companies to sponsor our test servers and paid for the rest our selves. It worked OK but we want to move away of being dependent of hosting companies and instead being able to choose hosts.
Keeping a performance monitoring tools like sitespeed.io up and running cost money. At the moment we use four cloud instances to run dashboard.sitespeed.io, run continuous test for sitespeed.io and browsertime. The cost for that is $200 per month.
The next step for us is to add monitoring on real mobile phones. We support both Android and iOS but at the moment the tests we do happens manually per release. We want to continuously run the tests and will use the money to find a company to host our phones.
We also want to have a comprehensive guide on how to run your tests on bare metal and to be able to do that, we need to have a bare metal server.
You can help us by supporting us at Open Collective!
CrUx data #
We have built a new Chrome User Experience Report plugin that comes bundled with sitespeed.io. The only thing you need to get CrUX data is a CrUx API key. We collect data for the specific URL and for the origin.
You can get the data per form factor, or for all of them. Read the documentation on how to best setup CrUx!
Other changes done earlier in 2020 #
We have done a lot of things earlier this year, we added support for Visual Metrics on Safari on OS X, use Safari Technology Preview on desktop and some tuning in using Safari on iOS.

We also added support for Microsoft Edge (Linux coming soon?).

We made sure sitespeed.io works on OS X, Windows and Linux without using Docker. If you want to run sitespeed.io without Docker, you can check our GitHub Actions as inspiration.
And we moved to use main as default branch for all projects.
And more in the latest release #
We also done a couple of bug fixes. Checkout the Browsertime changelog and the sitespeed.io changelog for the full list.
/Peter