Documentation / Web performance testing in practice
Web performance testing in practice
Start
This is a guide for you if you are new to performance testing. It will focus on synthetic testing (automatically driving a web browser and collecting performance metrics). The guide will focus on using sitespeed.io/Browsertime but it's mostly generic, so you can read this guide independent of the tool you use.
My name is Peter Hedenskog, I created sitespeed.io in 2012. I've been a performance consultant evaluating different performance tools and now I work in the performance team of the Wikimedia Foundation. I've spent many thousands of hours testing/thinking/evaluating/creating synthetic tools and I want to share what I've learned so far.
Why do performance testing
Is performance important? There are a lot of people advocating that performance is money. That may be true in some circumstances in some context for some sites, and the only way for you to know is to try it out.
What we do know is that there are no magic numbers in performance testing and that you need to set your own goals depending on your site and your users.
What I know is that measuring performance helps you be a better developer. Keeping track and making sure you do not introduce performance regressions is vital for you. Continuously measuring performance is the key. You can do that with real user measurement and synthetic testing. I'm going to focus on synthetic testing since that's my main area and where I'm most knowledgeable.
Why do synthetic testing
There's a couple of good things that you get when running synthetic/lab testing:
-
Collecting metrics that are more related to user experience than the technical metrics the browsers provide.
-
In a controlled environment that typically provides consistent test results, it is easier to detect regressions. It’s easier to spot smaller regressions than with RUM.
-
We can see changes very quickly when testing in a lab setting, because the only variable that is changing is the code. Being confident in RUM usually takes more time: you need to have more data to see the change.
-
In a lab setting, we are also able to control when browser versions are updated to new versions, allowing us to detect when browser releases impact user experience. Our users' browsers auto-update. A new browser version can affect the performance.
-
Lab testing and RUM (real user measurements) are best friends: synthetic testing improves your confidence in RUM and vice versa. If you see a regression in both types of measurements, you know for sure that it's a real regression.
But everything isn't perfect when testing in a lab: you are only testing a small usage group (a specific browser version, specific connection type, one operating system, a couple of URLs). You will miss out on a lot of user scenarios. That's why it's also good to combine your tests with real user measurements.
Setup
Let's go through some important things when you set up your synthetic tests. You want to deploy your performance measurements tool somewhere. You want to have stable metrics. You want to be able to trust your tool. You want to have an automatic way to find regressions.
Stability is your friend
The most important thing when setting up synthetic testing is getting rid of as much variance as possible. You need to make sure that your server performance, the internet connection and the tool are set up so that the metrics you collect are not influenced by anything other than the web page itself.
Internet connection/connectivity
The internet connection to your test server is probably really fast. And it can be different throughout the day. That will influence your tests.
If you throttle (making your connection slower) you can make sure you test under the same connection type all the time, and making the connection slower will make it easier for you to spot regressions in your code.
PLEASE, YOU NEED TO ALWAYS THROTTLE YOUR CONNECTION!
If you use sitespeed.io/Browsertime you can check out our connectivity guide.
Remember: always make sure you run on a throttled connection!
Servers
You need to run your tests somewhere, and you want to make sure that nothing else on that server interferes with your tests.
Choosing server
You can run on bare metal or using a cloud provider.
Cloud providers
We have tested almost all the available big cloud providers for sitespeed.io and I have also been testing different cloud solutions at my work at Wikimedia.
With our testing with Browsertime/sitespeed.io we have seen a big difference in stability between different providers. Remember that one of the reasons to use synthetic testing is to have stable metrics. If your server is unstable over time, it will be hard for you to know if there's a problem with the pages you are testing or with the server.
In our tests AWS has worked best, but you should try for yourself. When you run your tests, keep a close eye on your metrics and the deviation between runs.
Choosing instance type
Finding the right instance type is important: you don't want to pay too much, you want to have stable metrics, but you also don't want too fast an instance (since that will make the difference in some metrics really small and maybe harder to see). And you also do not want to use too slow an instance, since that will give you more unstable metrics.
Testing with WebPageTest we have seen that some browsers need bigger instances than others to produce stable and usable tests. The instance type depends on what kind of page you are testing and how stable you want your metrics to be.
At my work at Wikimedia we've been using c5.xlarge on AWS for both Chrome and Firefox and both WebPageTest and Browsertime/sitespeed.io. But that's mostly for testing Wikipedia. If your site has more JavaScript and third parties, it's possible that you need to run on a larger instance.
It's also possible that you can run on a smaller instance. I've seen that testing government sites (with fewer 3rd parties and less JavaScript) makes it possible to get stable metrics on smaller instances.
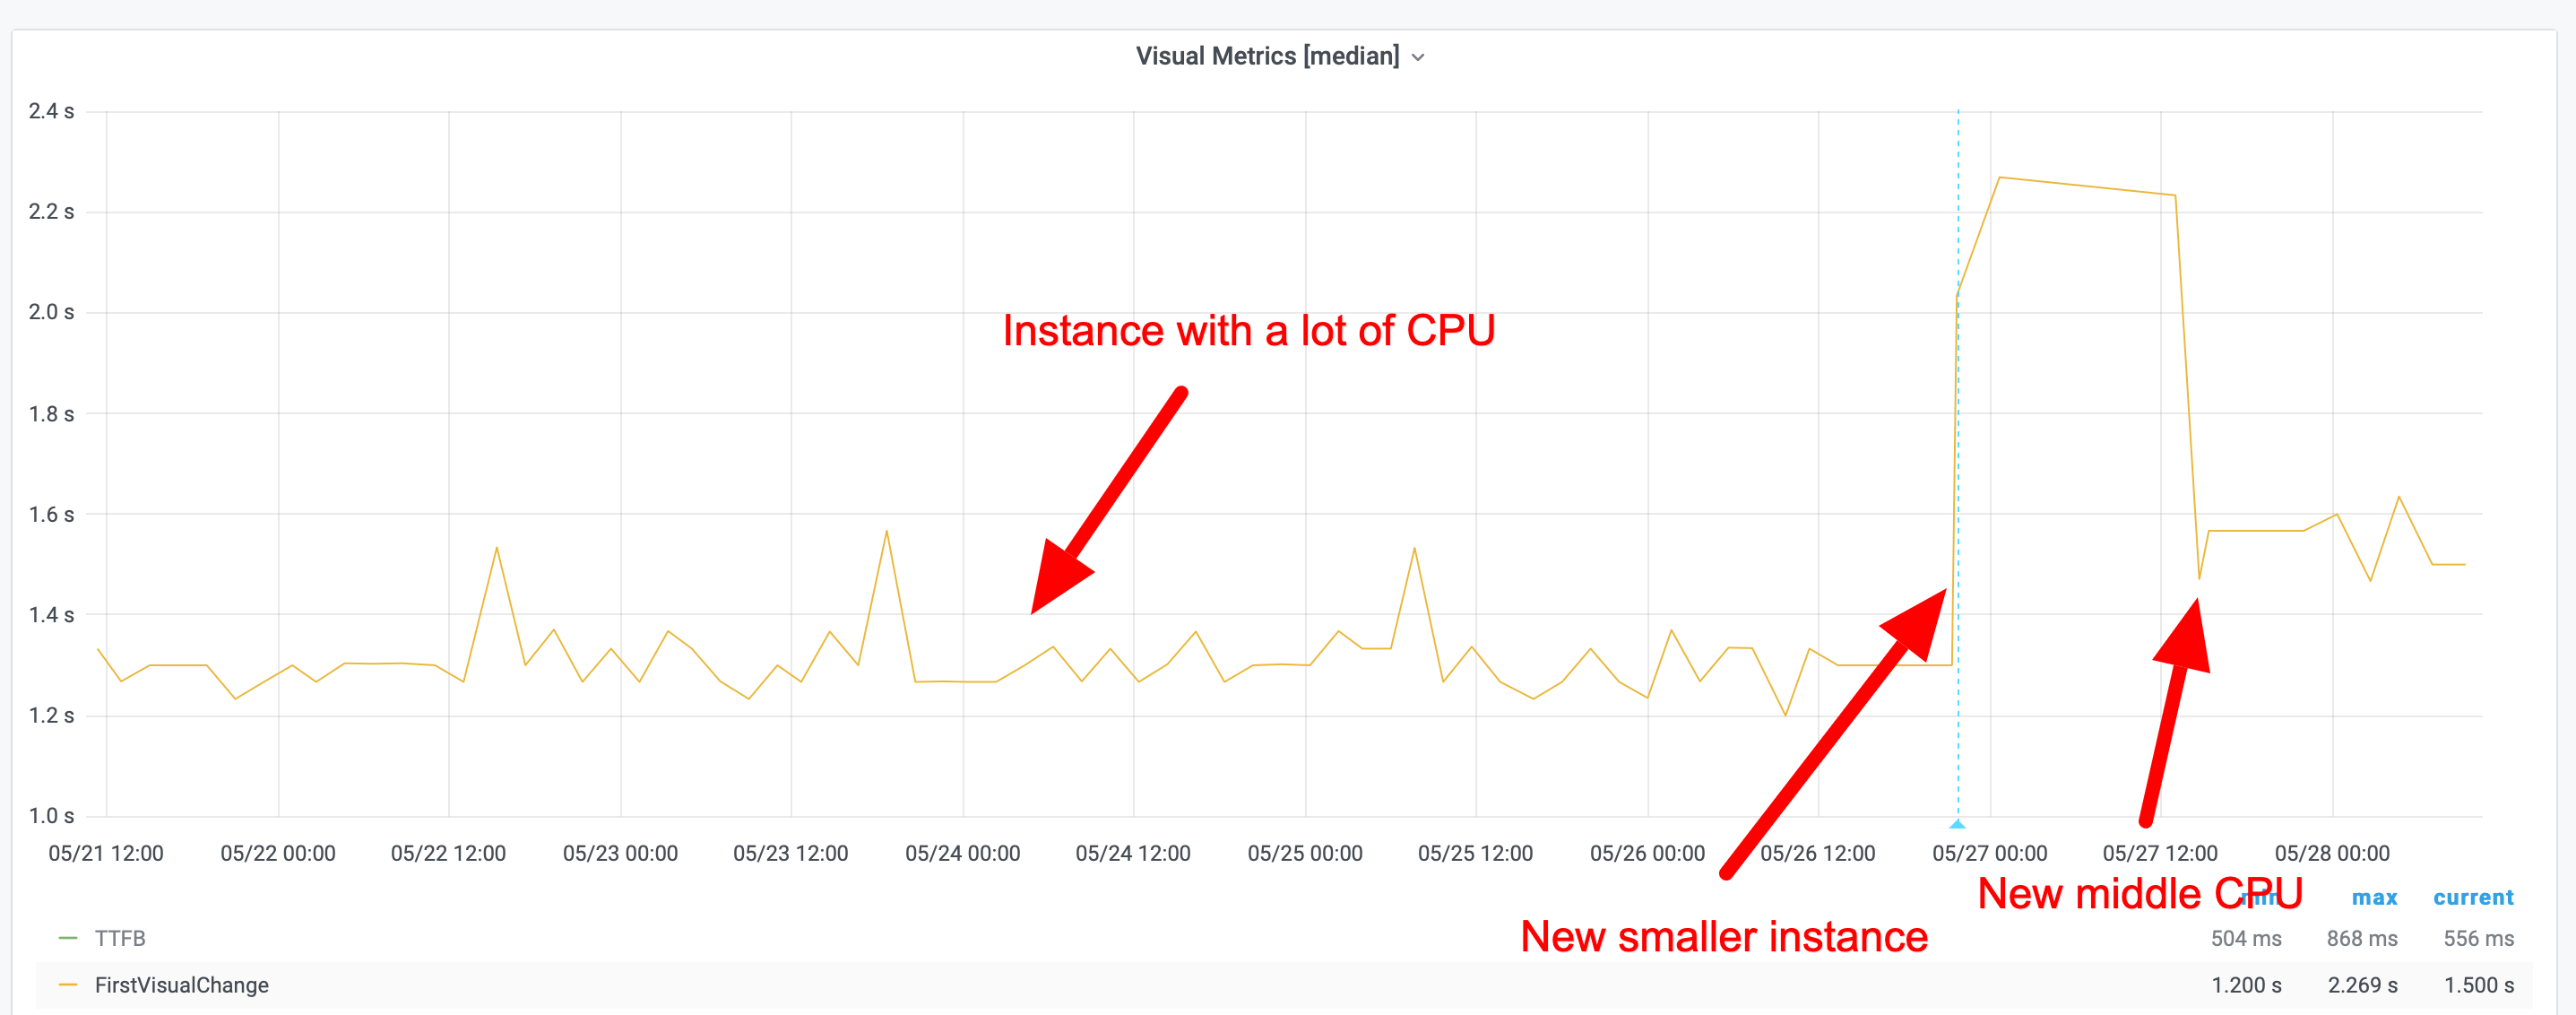
And also remember that all metrics will be dependent on what kind of instance type you use (CPU/memory etc). It will affect CPU metrics (long tasks etc) and all other metrics. Here's an example of what First Visual Change looks like running on three different instance types.
Choosing an instance
One thing that is important to know is that if you start an instance on AWS (and probably whatever cloud provider you use), it can have different performance than another instance of the exact same type! Netflix has seen a difference of 30% in performance, and when they spin up a new instance they actually spin up three, run some measurements and then take the fastest one.
We have also seen differences in performance and stability at the Wikimedia Foundation. Different instances can have different performance and stability. That's why we are not fans of spinning up many new instances, running the tests on them, and then destroying them. That will give you a bigger difference/instability in metrics than keeping one instance up and running for a long time.
However, keeping one instance (or multiple instances) isn't a bulletproof solution. We have seen performance shift over time on one instance (remember, a cloud server is just someone else's computer and others use that computer too, so you can get the noisy neighbour effect). That's why you need to keep track of deviation of metrics over time to make sure you can find when instances change.
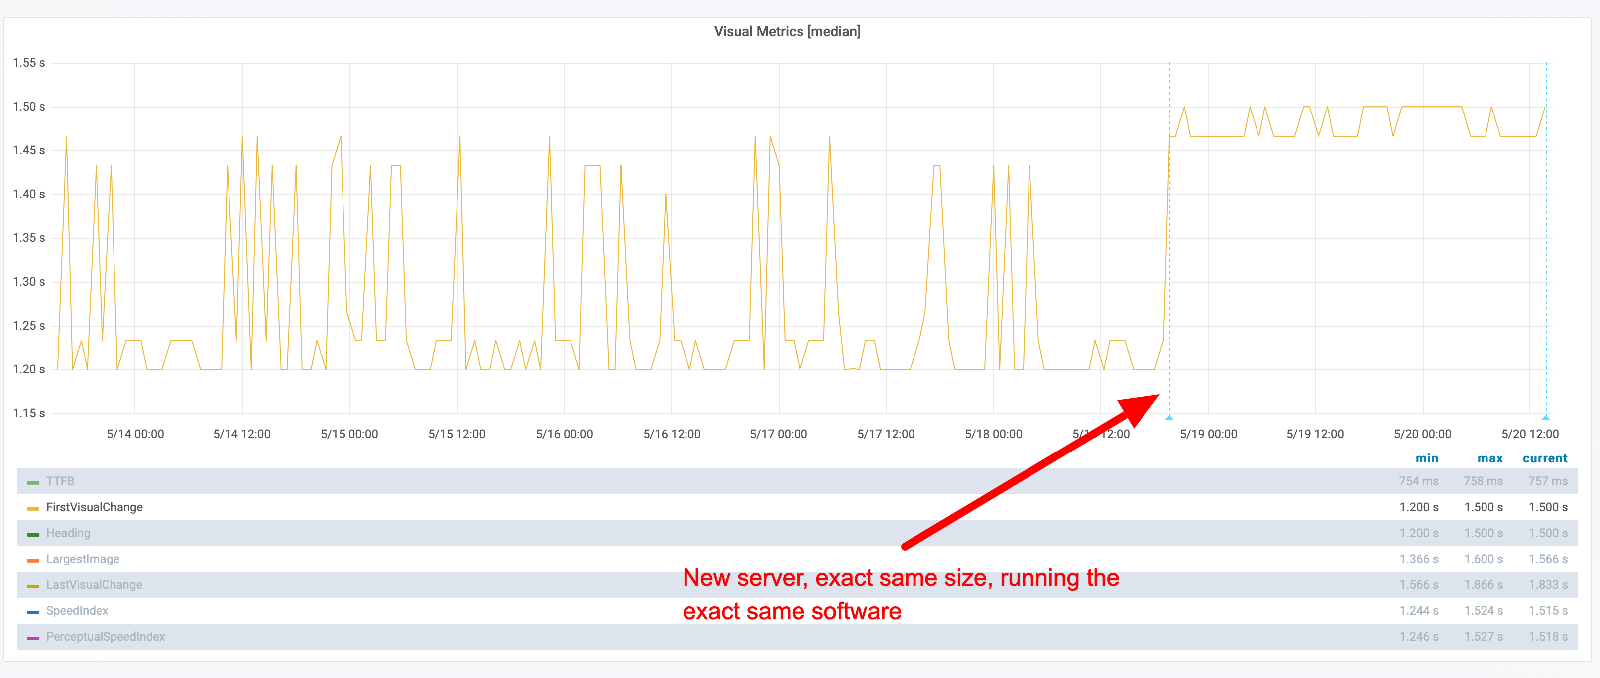
Let's look at some graphs. Here's an example where we switched to a new instance, the exact same instance type, running the exact same code. You can see that the new instance is slower but has much more stable metrics.
You can keep track of how "unstable" the metrics are by looking at the standard deviation. Here you can see the standard deviation when we replayed on a same size instance. 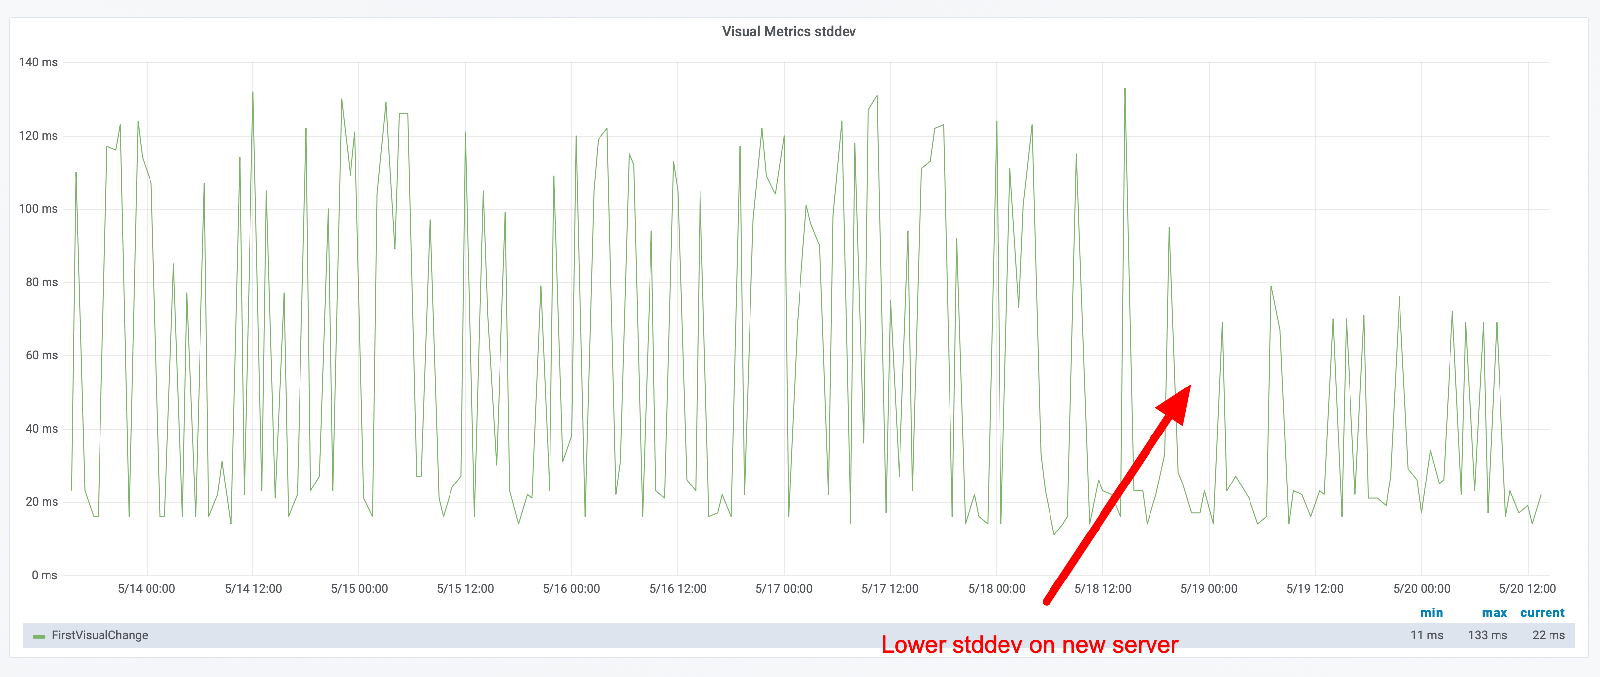
These metrics will be different depending on the URL you test (as long as you run different CSS/JavaScript). Here's another URL that we tested when we deployed on a new instance. Yeah, much more stable metrics. 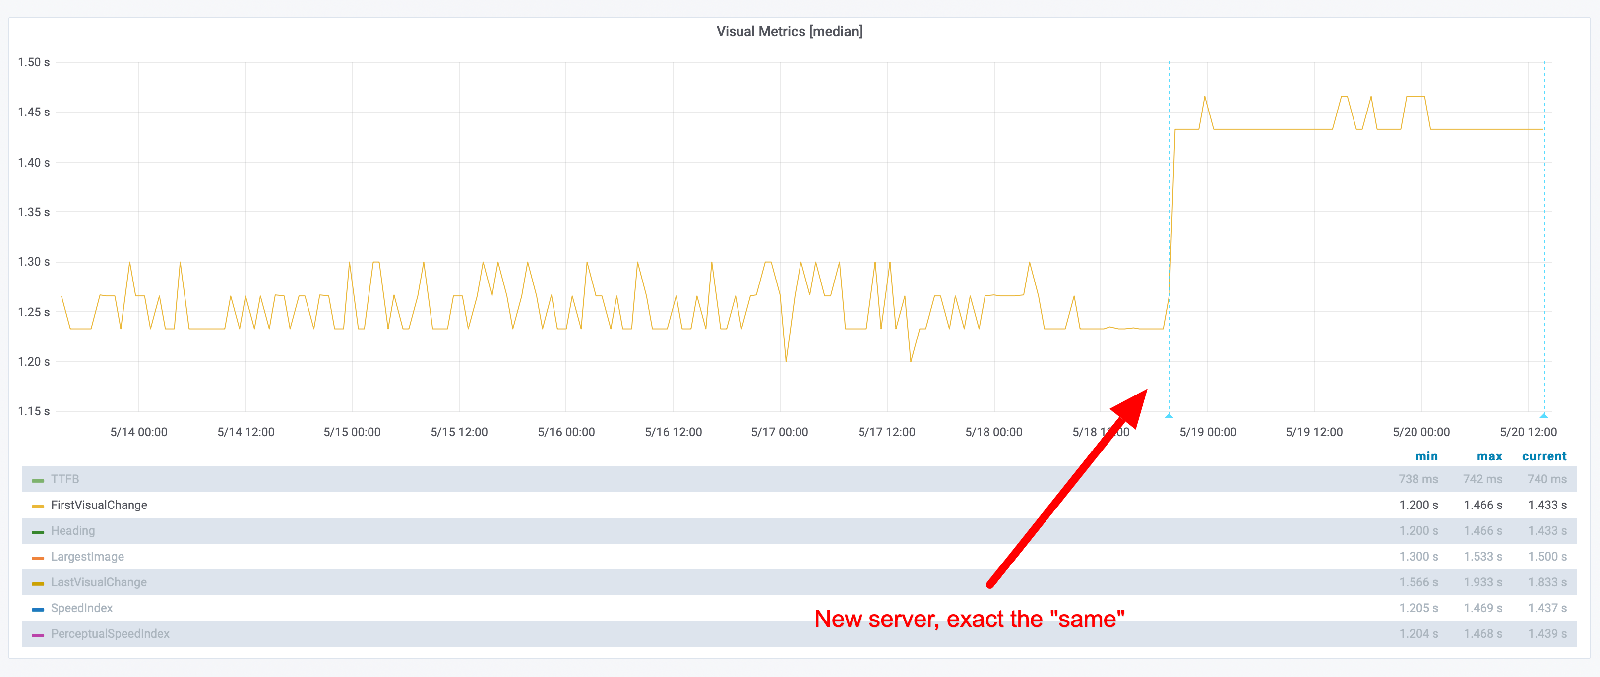
But look at the standard deviation. You can see that the max difference is now higher, but in general it looks like the deviation is lower. 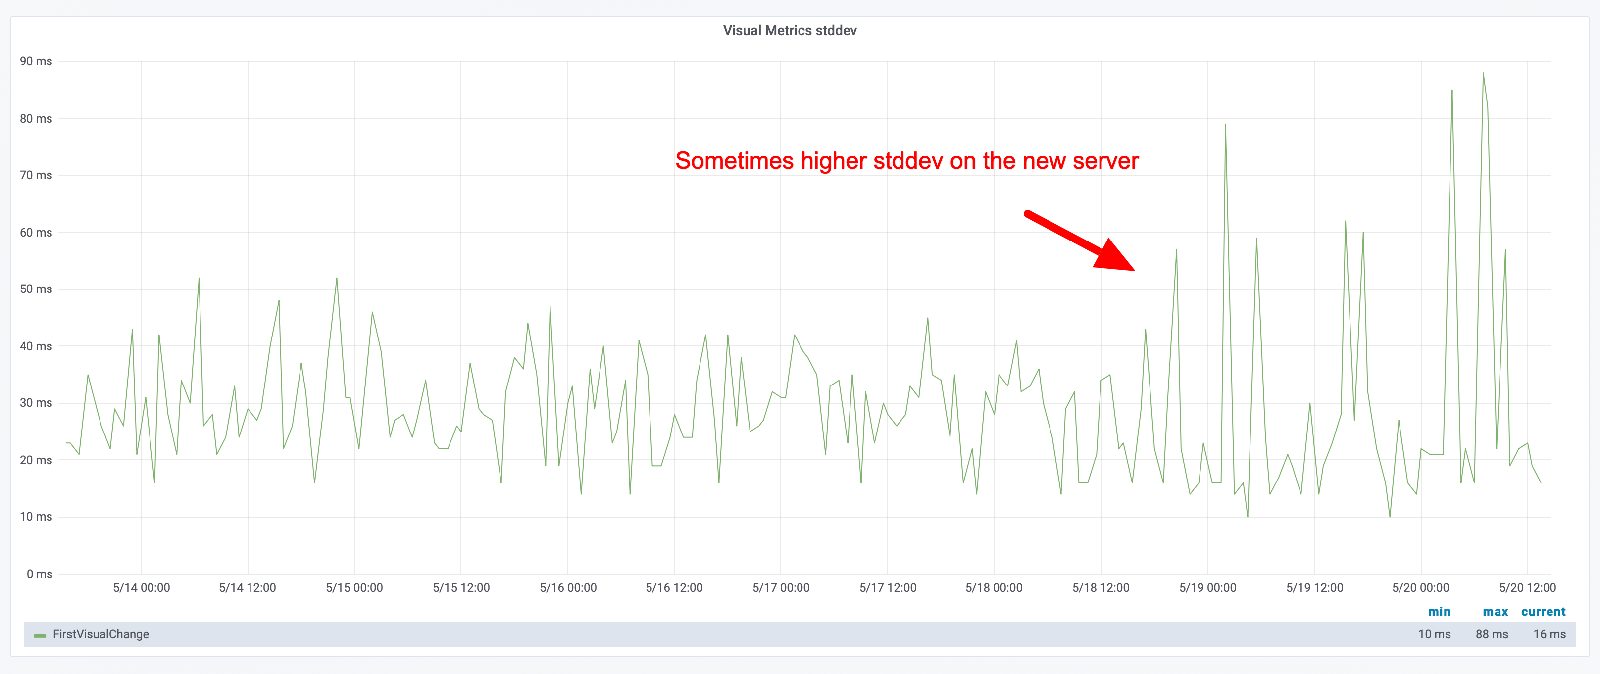
It's important that you keep track of standard deviation for your metrics and look for changes!
Tuning your instance
Before you start to run your tests, there are a couple of things you can do to tune your instance. It depends on the OS you are using but in general you should only run security updates automatically. For example, running on Ubuntu you can make sure you run unattended upgrade automatically.
Another good thing is to make sure you monitor your server to keep track of memory, disk and CPU usage. That can help you find reasons why performance metrics are unstable.
Running on bare metal
Running on bare metal servers helps you avoid the noisy neighbour effect. However, it doesn't automatically fix your problem. You still need to configure/tune your OS to get stable metrics. There are a couple of things you need to do:
Pin the CPU governor
Set the CPU governor to performance. The CPU governor controls how the CPU raises and lowers its frequency in response to the demands the user is placing on their device. Governors have a large impact on performance and power saving. You need to configure your server to have the same frequency all the time. If you are using Ubuntu you should set the governor to performance and pin the frequency. You can do that with cpufrequtils or the newer cpupower (by installing the linux-tools that match your kernel).
Install sudo apt-get install cpufrequtils and check out the help page. The key is to pin the min and max frequency to be the same.
Check how many cores and the min and max frequency by running cpufreq-info. Then you can see how you can set the frequency with cpufreq-set --help.
Say that the max frequency for your server is 4.00 GHz and you want to pin it to use 2.00 GHz (in practice you want to match the frequency to what your users have, and you can do that with the CPU benchmark). Then you use the cpufreq-set command.
cpufreq-set -d 2.00Ghz -u 2.00Ghz -g performance
That sets the governor to performance and pin it to 2.00Ghz. Then you need to do that for all your cores. You choose core with -c so if you have two cores you should run:
cpufreq-set -d 2.00Ghz -u 2.00Ghz -g performance -c 0
cpufreq-set -d 2.00Ghz -u 2.00Ghz -g performance -c 1
Choose DNS server
Which DNS server is used can make a big difference. Keep an eye on your DNS times and make sure they are stable. If not, read the manpage on how to change it.
Open files
The number of open files can be quite low on Linux, check it with ulimit -a. Increase it by following these instructions.
Running on Kubernetes
If you are going to use Kubernetes, you should use the bandwidth plugin to set the connectivity. If you are a Kubernetes user, please share your configuration and setup so we can add it to the documentation.
Mobile
To run mobile phone tests you need to have a phone and somewhere to host your phone.
Mobile phones
The most important thing when monitoring performance using real mobile phones is that you test on the exact same phone all the time. The same model is not the same as the same phone. Even when you run tests on the same model, running the same OS, you can get very different results.
The Facebook mobile performance team wrote about it and we have seen the same at Wikipedia. That's why solutions where you cannot pin your tests to an exact phone are useless for monitoring. You can still use those tests to get a "feeling" for the performance, but it's too unreliable for monitoring.
A couple of years ago we tested with Chrome, measuring start render on Wikipedia using a Moto G4 on WebPageTest, and the result (median) looked like this:
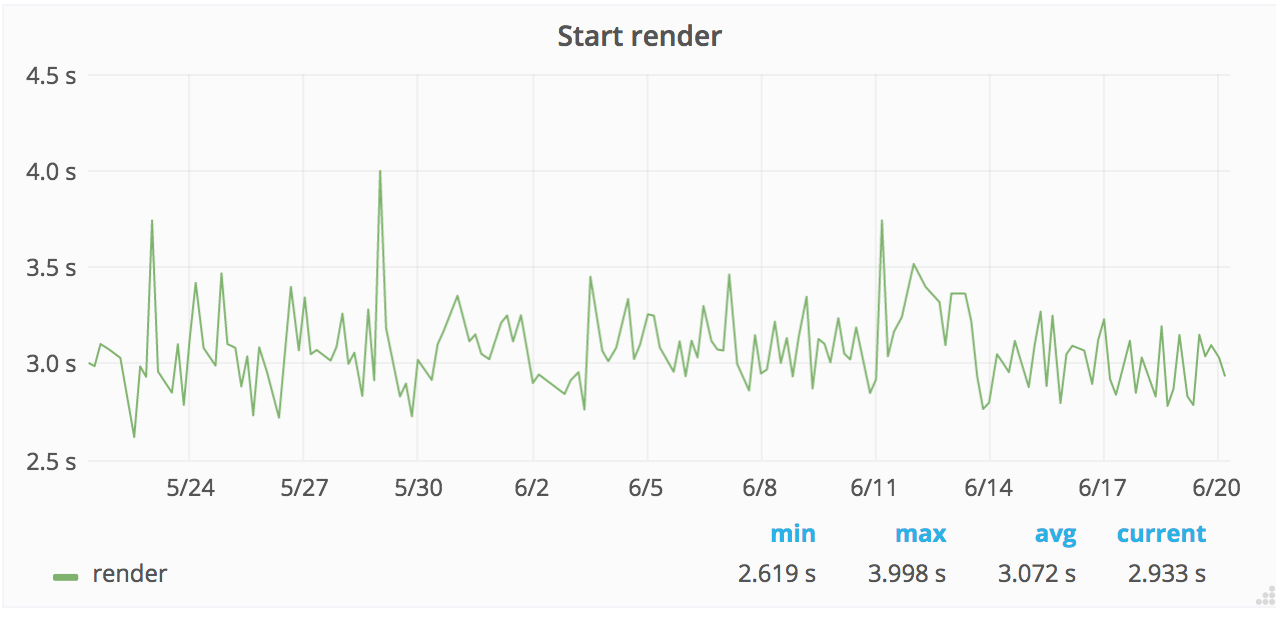
The problem was that we were running on different phones (but the same model) and we are pretty far from the flat line that we want.
There's a workaround for this problem: when you set the CPU/GPU performance and pin those, you will get more stable metrics. To do that you need to run your test on a phone where you can use root.
What phones should you use? If you plan to run tests on Android you should aim for a phone in the middle market segment. Using slow phones is good for showing the performance for some of your users, but getting stable metrics on slowish phones is hard. I've been using Moto G4 and G5. At Wikimedia we run phones that match our 75/95 percentile of our users' performance.
One problem running tests on Android is that when the phone temperature gets high, Android will change CPU frequencies and that will affect your metrics. To avoid that you can check the battery temperature before you start your tests (that's implemented in Browsertime/sitespeed.io). You can also root your phone and then set the frequency for your CPU so that it will not change. That is supported for Moto G5 and Pixel 1 using Browsertime/sitespeed.io (thank you Mozilla for contributing that part).
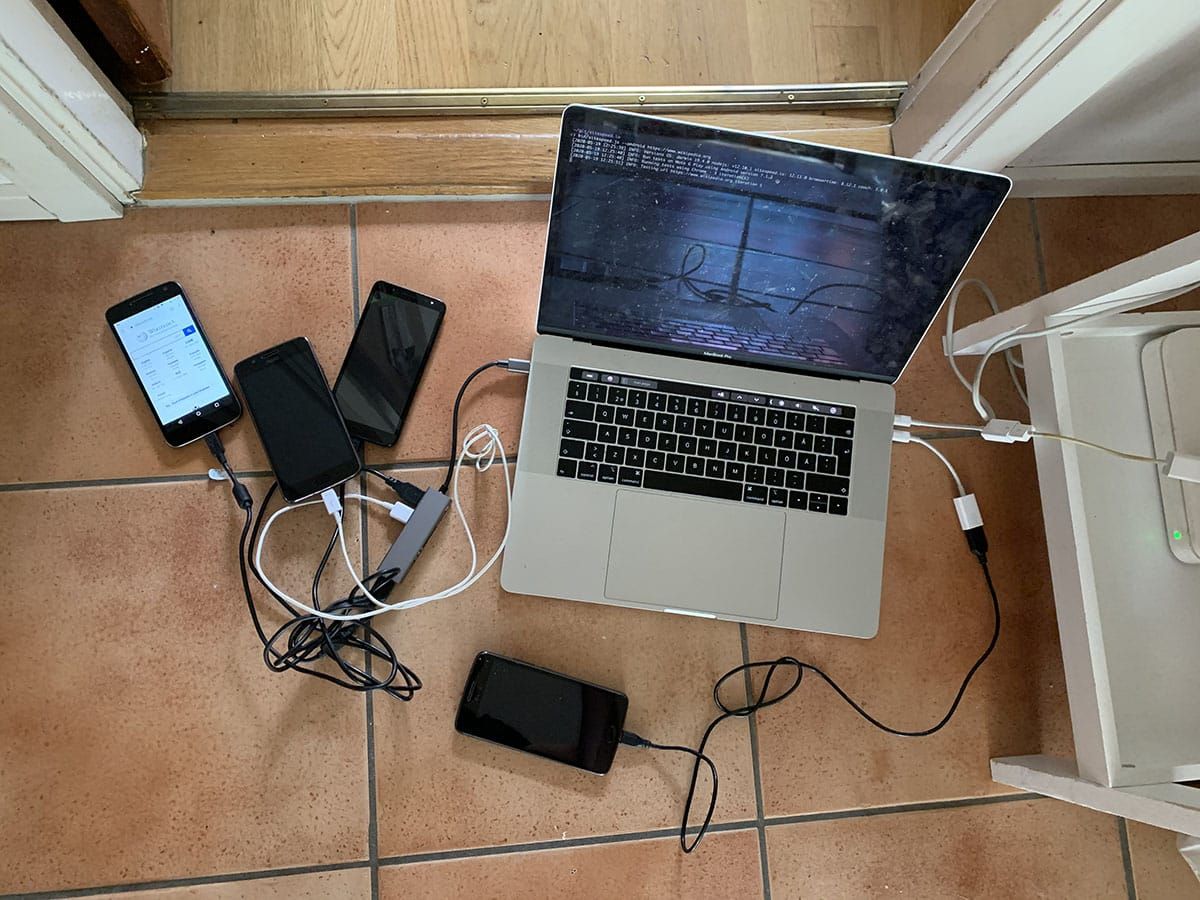
Mobile hosting
To run your test you can either host your own mobile phones and drive them through a Mac Mini, Raspberry Pi or find a hosting solution that can do the same. At the moment we do not have any recommendations for hosting, except for hosting the solution yourself. If you use sitespeed.io we have a pre-made Raspberry Pi to run your tests.
Number of runs
You want to have stable metrics so you can find regressions. One way to get more stable metrics is to make many runs and take the median (or fastest) run.
The number of runs you need depends on the servers you use, the browser (and browser configuration) and the URL that you test. That means you need to test yourself to find what works for you. For example, at Wikimedia we get really stable metrics for our mobile site with just one run using WebPageReplay as a replay proxy. But for the English desktop Wikipedia we need 5/7/11 runs for some URLs to get more stable metrics (because we run more JavaScript that executes differently). And for other languages on Wikipedia we need fewer runs.
You should start out by doing 5 runs. How big is the difference between your runs? Is it seconds? Well then you need to increase the number of runs. You will probably have some flakiness in your tests, but that is OK, as long as you can see regressions. The best way to find what works for you is to test over a period of time. Check your metrics, check your min and max and the deviation over time.
But vendor X of tool Y says that 3 runs is enough?
I'm pretty sure this is the same for all tools as long as you test with real browsers. It depends on your server, your browser and the page you test. You need to test to know!
Browsers
Your page could render differently in different browsers, since they are built in different ways. It's therefore important to test your page in multiple browsers. Using sitespeed.io you can use Chrome, Firefox, Safari and Edge. But it takes time to test in all browsers, so start by testing in the ones that are most important for you.
Browsers change with each release, so it is important to upgrade the browser you use in the tests, the same way your users' browsers are updating. If you run the sitespeed.io Docker containers, we release a new tagged version per browser version. You can then update in a controlled way.
It's really important to be able to roll back browser versions in a controlled way so that you know if a metric change is caused by the browser, by your website or by your environment. It's essential to be able to pin your tests to a browser version.
Choosing metrics
Through the years of performance testing, different metrics have been the golden child: loadEventEnd, first paint, Speed Index, RAIL, Google's Web Vitals and more.
All these metrics try to answer the question: is your web page fast?
What we do know, looking at the history of performance testing, is that the "best" metric will change over time. Which one should you choose? If you look at all the metrics that are collected, it's easy to feel confused and not know which metric is the most important. Since metrics change over time, I think it's important to collect as many as possible (so you have the history) and then focus on one or a couple of them.
You can either focus on performance timing metrics (like First Visual Change, Total Blocking Time etc.) or you can use a score that is calculated based on how performant you have created your web page and server. Using timing metrics is good because they are usually easier to understand and reason about; using a performance best practice score like the Coach score is good because it will not change depending on the performance of the server that runs your test.
Using the Lighthouse performance score combines both timing metrics and a best practice score. The problem with that is that the score will be different depending on what server and what connectivity the server uses. When your boss tests your website using Google Page Speed Insights, they will get a score that differs from what you present in your performance report with metrics from your test server (even though you use the same tool). That's no good for you as a developer when you want to build trust in your metrics.
Does your company/organisation have a way to study your users and find out what metric is important? Start with that. If you can't do that, focus on a metric that is important for you as a developer and that you are responsible for. One metric that should be independent of third parties is First Visual Change/First Paint. If it isn't for you, that's your first mission: make sure your first paint is independent of others.
When to run your tests
When should you run your tests? Well, it depends, what do you want to do with the numbers you collect?
If you run tests against your competition, comparing your website against others, you could run the tests once a day or a couple of times a day.
If you want to find regressions, you want to run your tests as often as possible, or at least as often as you release or make content changes in production. You can follow our instructions on how to continuously run your tests.
Choosing URLs
What pages should you test? What user journeys are the most important ones? If you are new to performance testing, I think it's important to start small. Start with a couple of URLs to test (the most important ones on your website) and focus on one or two user journeys. Test them continuously and watch the metrics.
If you have an active content team that can update HTML/CSS/JavaScript on your pages directly in production, you should also test using crawling. That way you can find problems on pages that you normally do not test.
Getting stable and useful metrics
Getting stable metrics is hard. If you have any doubts, look at "Performance Matters" by Emery Berger.
If you have throttled the internet connection and deployed on a stable server, there are still some things you can do.
You can also use a replay server to try to minimize the noise. The sitespeed.io Docker container includes WebPageReplay that the Chrome team uses. Mozilla uses mitmproxy. You can choose whichever works best for you.
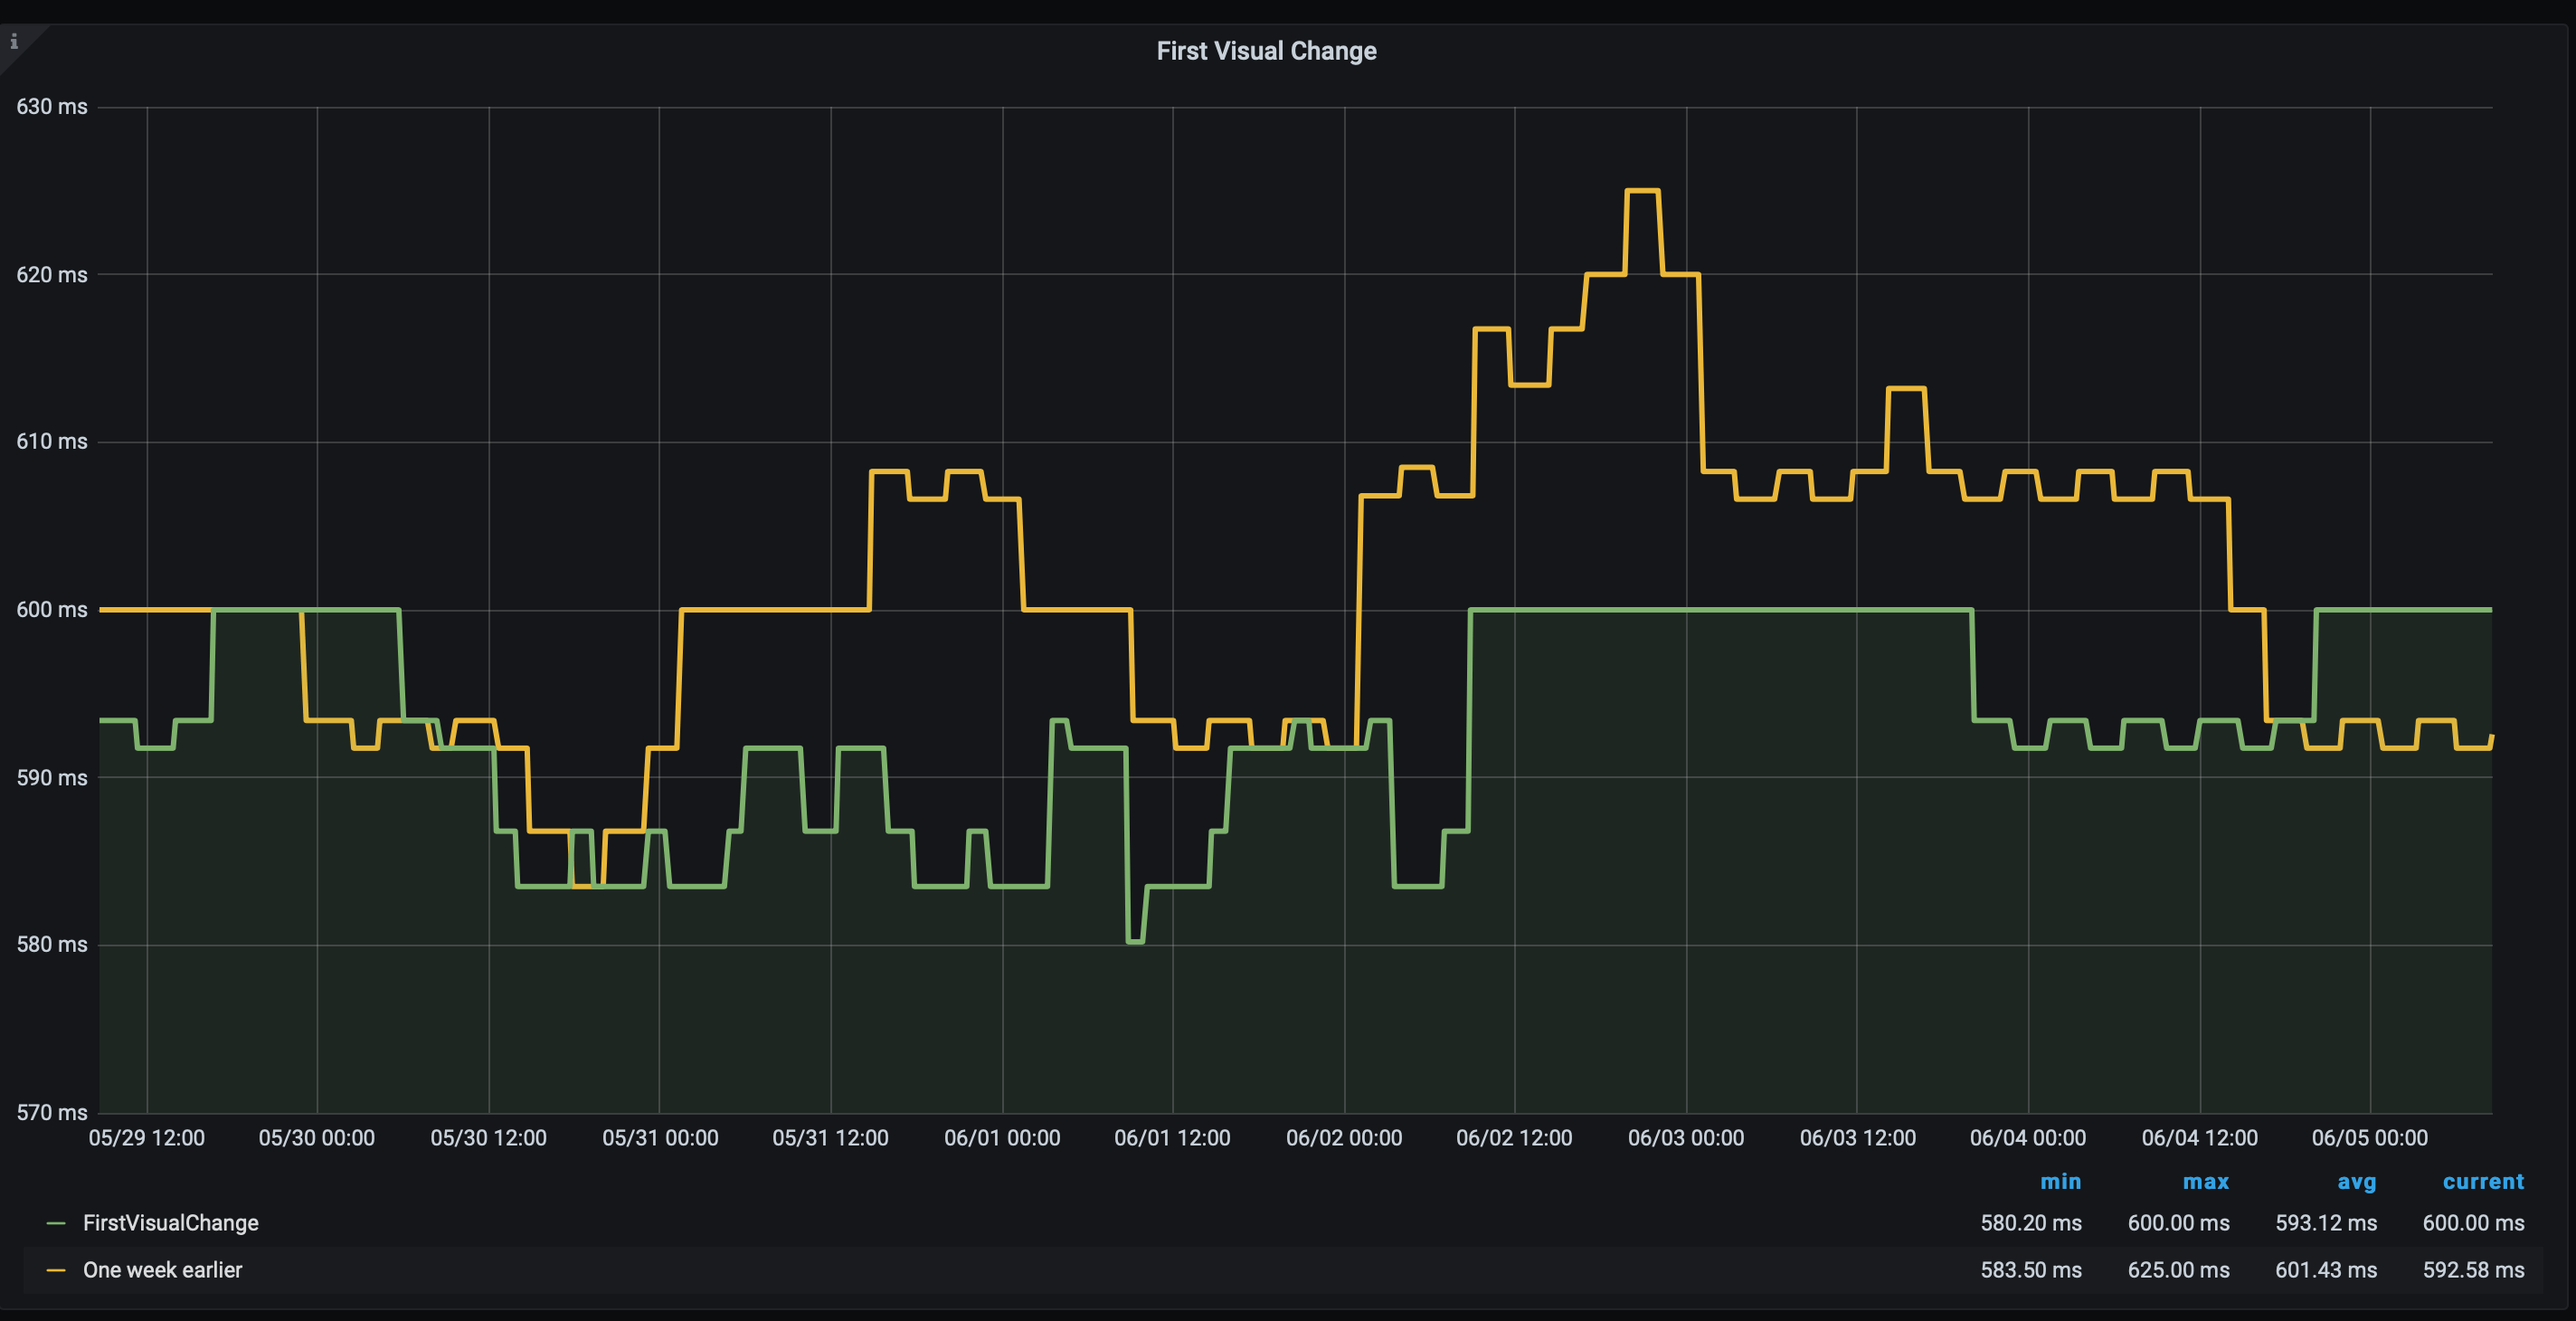
Another way is to look at metric trends and compare metrics with one week back in time to find regressions. This is a technique that Timo Tijhof has been using for a long time, and we adopted it in sitespeed.io years ago.
A good way to test the stability of your tests is to set up a static HTML page on your server. You can take one of your important pages, store the page as HTML, and make sure the CSS, JavaScript and images are the same over time (hard-code it so the correct versions are used). Add that page to your tests to see what kind of variance you get. Continue to test that page as long as you run your tests, to have a baseline.
Dashboards
One of the most important things to keep control of your performance is graphing the metrics. Having graphs to show your co-worker or your boss is vital. Many performance tools use their own home-built dashboards. Don't use those. You should use Grafana. It's the best monitoring/dashboard tool out there (and it is Open Source). If you haven't used it before, you will be amazed. Sitespeed.io ships with a couple of default dashboards but with the power of Grafana it's easy to create your own.
What's extra great (for you) is that Grafana supports multiple data sources, meaning you can easily create dashboards that get data from your sitespeed.io runs, integrate it with your RUM data and with your business metrics like conversion rate. The potential with Grafana is endless.
Choosing tools
You are ready to start running performance tests, what tools should you use? I personally think you should use sitespeed.io or Browsertime:
- We have all the metrics you need and you can add your own metrics. It is fully flexible.
- You can build your own plugins that can use other tools or data storage.
- You own your data, you are in full control of metrics and you can scale your testing as you want.
- You can deploy the tests wherever you want and be in full control of instance size and type.
- We've got the most powerful testing there is on Android devices.
- You will use Grafana to graph your graphs. Grafana is used by CERN, NASA and many tech companies like PayPal, eBay and Digital Ocean, and it will surely work for you too.
- We have a lot of documentation and we are really fast at helping you if you create an issue on GitHub.
- We've got the best looking logos :D
The only problem with sitespeed.io is that there are many (paid) tools that think you should avoid sitespeed.io, maybe you have seen this poster before?

What's important is that you try out different tools and choose the one you like best. Don't listen to performance consultants who get some extra money on the side from the synthetic tool providers, instead test and choose for yourself!
sitespeed.io
Sitespeed.io is the main tool to collect performance metrics, store the data and graph it. You can also use it to drive WebPageTest, GPSI and Lighthouse, and to create your own plugin. GitLab uses sitespeed.io as their performance tool.
Browsertime
Browsertime is the engine that starts the browser and gets the metrics. The outcome is raw JSON. Use Browsertime if you are building your own performance tool. Mozilla uses Browsertime in their performance tests.
Comparing the synthetic testing tools
There's no neutral way to do this (I'm the maintainer of one of the tools), but here's a side-by-side of what's on the market today, so you can use it as a starting point and check the things that matter to you.
The tables below are split in two so they actually fit on a screen: the first covers ownership and pricing, the second covers what the tool can do. Tables verified on 2026-05-07. Vendors change pricing and features all the time, so re-check the linked pages before you sign anything.
Behind the tools
| Tool | Behind it | Licence | Self-host | Engine | Pricing (2026-05-07) |
|---|---|---|---|---|---|
| sitespeed.io | Independent OSS, maintainers in Sweden | MIT | Yes — only mode | Browsertime + Coach + custom | Free |
| WebPageTest | Catchpoint (US, PE-owned) | Source-available agent (Polyform Shield, not OSS) + closed SaaS | Yes (private instance) | WPT agent | Free 150 runs/mo · Pro from ~$180/yr · Expert from $999/mo |
| Lighthouse | Apache 2.0 | Yes (CLI/CI) | Chrome DevTools Protocol | Free | |
| SpeedCurve | Embrace (US, VC-backed; acquired Nov 2025) | Closed SaaS | No | WPT-agent fork + LUX RUM | From $90/mo |
| Calibre | Calibre Analytics, Australia | Closed SaaS | No | Lighthouse + CrUX + RUM | Starter $75/mo (5,000 synthetic tests) |
| DebugBear | Independent, UK | Closed SaaS | No | Lighthouse + custom | Volume-based; check vendor page |
| Treo | Independent | Closed SaaS | No | Lighthouse | Free tier · Vital from $75/mo |
| Catchpoint Synthetic | Catchpoint (US) | Closed SaaS | Private nodes possible | Proprietary + WPT | Enterprise quote |
| Datadog Synthetics | Datadog (US, public) | Closed SaaS | Private locations only | Proprietary | Per 1k browser tests; check vendor page |
| Dynatrace Synthetic | Dynatrace (Austria/US, public) | Closed SaaS | Private nodes | Proprietary | Enterprise quote |
| New Relic Synthetics | New Relic (US, private) | Closed SaaS | Private minions | Chrome via Selenium | 500 checks free · $0.005/check overage |
Capabilities
| Tool | Real browsers | Real mobile devices | Scripted journeys | Real network throttling | Video & visual metrics |
|---|---|---|---|---|---|
| sitespeed.io | Chrome, Firefox, Edge, Safari (Mac/iOS) | Android & iOS over USB | Yes (JS) | Yes — packet-level on agents | FFmpeg video, SpeedIndex, last visual change |
| WebPageTest | Chrome, Firefox, Edge, Safari | Android & iOS if you self-host | Yes (WPT scripting) | Yes — packet-level on agents | Video + filmstrip + visual metrics |
| Lighthouse | Chrome only | Emulated only | Yes (startFlow() + Puppeteer) | Simulated by default; DevTools optional | Screenshots in trace, no video |
| SpeedCurve | Chrome, Firefox, Safari, Edge | Emulated | Yes | Yes — inherits from WPT agents | Filmstrip + visual metrics |
| Calibre | Chrome | Emulated | Yes | DevTools-level (browser-side) | Filmstrip |
| DebugBear | Chrome | Emulated | Yes | DevTools-level | Filmstrip + video |
| Treo | Chrome | Emulated | Limited | Simulated (Lighthouse-style) | Filmstrip |
| Catchpoint Synthetic | Chrome, IE legacy, others | Real device cloud add-on | Yes | Yes — agent-side | Video |
| Datadog Synthetics | Chrome, Firefox, Edge | Emulated | Yes | DevTools-level | Recording + screenshots |
| Dynatrace Synthetic | Chrome | Emulated | Yes | DevTools-level | Video |
| New Relic Synthetics | Chrome | Emulated | Yes | DevTools-level | Screenshots + step-level visuals |
Notes: the take
sitespeed.io: Built the way I'd want a perf tool to work: open source, your data on your boxes, real browsers, real devices, real network shaping, real video. No SaaS lock-in. Trade-off: you run it yourself, and the dashboards are whatever you wire up to Graphite, InfluxDB or OpenSearch.
WebPageTest: Source-available, not OSS, and in slow decline since Catchpoint bought it in 2022. Engineering investment on the public codebase has fallen off a cliff: the agent repo (the part that actually does the measuring) had 384 commits in 2022, 50 in 2024, and 2 in all of 2025. The licence on the agent quietly moved to Polyform Shield, which restricts commercial reuse. The hosted SaaS still runs, but Catchpoint's strength is enterprise APM and network monitoring, not running performance test agents on real bare metal, and the gap shows. Self-hosting still works on the existing code and is how most teams who care about WPT actually use it, just be aware you're running an effectively unmaintained project.
Lighthouse: Free, scriptable, and the de-facto baseline for "is this page OK?". But it's a single-shot audit tool with simulated throttling by default, so it tells you what would happen, not what did. Use it for CI gates and sanity checks; reach for a real measurement tool when the numbers stop matching reality.
SpeedCurve: Long-standing commercial synthetic + RUM platform that runs its own fork of the WPT agents. Historically that meant SpeedCurve got most of its measurement engine for free from WPT's open development; with WPT now in hibernation (see above), they're stuck maintaining a fork of an unmaintained engine, with no upstream to pull from.
SpeedCurve was acquired in November 2025 by Embrace, a VC-backed mobile-observability vendor (~$80M raised) adding a web story to its product, the same playbook that left WPT in hibernation under Catchpoint. Whether SpeedCurve ends the same way depends on Embrace's appetite for funding niche perf engineering after the integration honeymoon.
Closed SaaS, expensive at any real volume, and your data lives with them, now with the added wrinkle that "them" is no longer the company you originally signed up with.
Calibre: Independent, Australian-owned, focused on "performance budgets meet team workflow". Smaller scope than SpeedCurve but cheaper entry point and a clearer product. Lighthouse-based, so inherits Lighthouse's throttling caveats.
DebugBear: Sharp on developer experience, good filmstrips and a clean UI. Lighthouse-based engine, so the same simulated-throttling caveats apply as for the other Lighthouse tools on this list. Still independent and founder-led, which is rare on this list.
Treo: Lightweight, Lighthouse-as-a-service. Cheap. Limited if you need scripted journeys or anything beyond "monitor these N pages".
Catchpoint Synthetic: Enterprise synthetic platform from the same parent that owns WebPageTest. Sales-led, opaque pricing, broad global footprint with real-device add-ons. If you already pay Catchpoint for network/DNS monitoring, plugging in synthetic checks is mostly a contracting exercise; if you don't, the price tag and the contract are the story. The same parent letting WebPageTest decay (see above) isn't a strong signal that perf engineering is a priority.
Datadog Synthetics / Dynatrace Synthetic / New Relic Synthetics: Three flavours of the same story: synthetic browser checks bolted onto an APM platform. Closed engines, DevTools-level throttling at best, no real device support, no real performance focus. Worth turning on if you already pay for one of them and just want a "did the deploy break it" signal next to your APM data. If you actually care about web performance, please use something else on this list. (New Relic's 500 free checks/month is the only standalone reason to pick any of them.)
What the tool is actually optimising for
Every tool on that list is optimising for something, even when nobody says it out loud. It's worth asking what that something is, because it shapes everything: which features get built, which ones quietly never ship, and where the rough edges end up.
A paid SaaS is optimising for revenue. That isn't an insult, it's how companies work. But it means features the salesperson can demo win over features that make you self-sufficient. Pricing pages stay opaque so sales can price-discriminate. Lock-in is a feature, not a bug. And when the company gets acquired (it usually does, like Catchpoint with WebPageTest in 2022), the new owner's priorities shape the product, not the original founders'.
Sitespeed.io is optimising for the web getting faster. That's it. There's no upsell, no enterprise tier, no quarterly target. The maintainers are people who measure performance for a living and would build most of this anyway, and the open-source release is "here's the thing we'd want to use, you can have it too." The trade-off is honest: less polish than a venture-funded SaaS, no salesperson to call when something breaks, but also no surprise renewal quote and no risk of your data being absorbed into someone's exit.
This isn't a moral argument that one is "good" and the other is "bad". It's a question of whose interests line up with yours. If a SaaS vendor's incentive is to keep you paying and yours is to ship fast pages, those overlap a lot of the time, until they don't.
Running tests using sitespeed.io
Let's talk about running tests on sitespeed.io.
Testing on desktop
Running your tests on desktop is the easiest tests to run. You can choose to run your tests in a ready-made Docker container or you can invoke the Node.js package directly.
The Docker container comes with pre-installed Chrome and Firefox (latest stable versions) and all the dependencies needed to record and analyse a video of your test to get visual metrics. We release a new Docker container for each stable Chrome/Firefox, so that way you can roll back versions easily. What's also good with the Docker container is that you start a new container per test, so everything is cleaned between tests. The drawbacks of running in a container could be slower metrics and only support for running Chrome and Firefox. If you are new to using Docker you should read our Docker documentation.
If you use the Node.js version directly, you can run tests on Safari and MS Edge as long as your OS supports it. To record a video and analyse it to get visual metrics, you need to install those dependencies yourself. Our Browsertime GitHub Actions workflows (linux-chrome.yml, linux-firefox.yml, mac.yml, safari.yml) show what to install per OS.
You also need to manage the browsers by manually updating them when there's a new version. There's more work to keep your tests running, but you are also in control and can test on more browsers.
Testing on mobile
You can try to emulate mobile phone testing by running your tests on desktop and emulating the browser by setting another viewport, user agent and slowing down the CPU. But it's hard to emulate the performance of a real device.
Using sitespeed.io you can test on Android and iOS devices. Android has more support for performance metrics (video/visual metrics). When you test on mobile phones you need to prepare your phone for testing (enabling access/turning off services) and we have all that documented in the documentation for mobile phones.
Our work together with Mozilla has made Browsertime/sitespeed.io the most advanced performance measurement tool for Android, you should really try it out!
Testing user journeys
By default sitespeed.io tests your page with a cold cache test. That means a new browser session is started per run with the browser cache cleared between runs. However, you probably have users who visit multiple pages on your website. To measure the performance of multiple pages (during the same session) you should use scripting.
With scripting you can test the performance of visiting multiple pages, clicking on links, logging in, adding items to the cart, and almost everything the user can do.
What data storage should I choose (Graphite vs InfluxDB)
sitespeed.io supports Graphite out of the box and InfluxDB through a separate plugin, and you can write your own plugin to store metrics elsewhere.
But what should you choose? We recommend that you use Graphite. We use Graphite in our setup so Graphite will get a little more love. Keeping a Graphite instance up and running for years and years is really easy and the maintenance work is really small.
But when should you use InfluxDB? Well, almost never :) The great thing with Grafana is that you can have different data sources, so even if your company is already a hardcore InfluxDB user, your Grafana instance can get data from both Graphite and InfluxDB.
Summary
If you want to use sitespeed.io for your synthetic monitoring testing you can dig deeper into the documentation. If you have problems/issues the best way is to create an issue on GitHub. That way others can also help out and find the solution. If you have a bug, it's super useful if you help us by creating a reproducible issue.
If you want to chat about setup you can do that in our Slack channel.