Sitespeed.io 4.5.0 - for connoisseurs only?
No that is not true! 4.5 got some awesome things that will help us all.
New best practice for setting up connectivity
As reported by Benedikt Christoph Wolters the connectivity setup for tc for Docker wasn't perfect, it only added latency and limited upload. Jonathan has created better way to do this by setting up Docker network bridges. Here's quick one on how you do that:
docker network create --driver bridge --subnet=192.168.34.0/24 --gateway=192.168.34.10 --opt "com.docker.network.bridge.name"="docker2" cable
tc qdisc add dev docker2 root handle 1: htb default 12
tc class add dev docker2 parent 1:1 classid 1:12 htb rate 5mbit ceil 5mbit
tc qdisc add dev docker2 parent 1:12 netem delay 28ms
You then have network called cable that you can use from your Docker container by adding --network=cable to your Docker commands.
docker run --privileged --shm-size=1g --network=cable --rm sitespeedio/sitespeed.io -c cable --browsertime.connectivity.engine external https://www.sitespeed.io/You have more examples here and would love feedback and PRs on how to do the same on platforms not supporting tc.
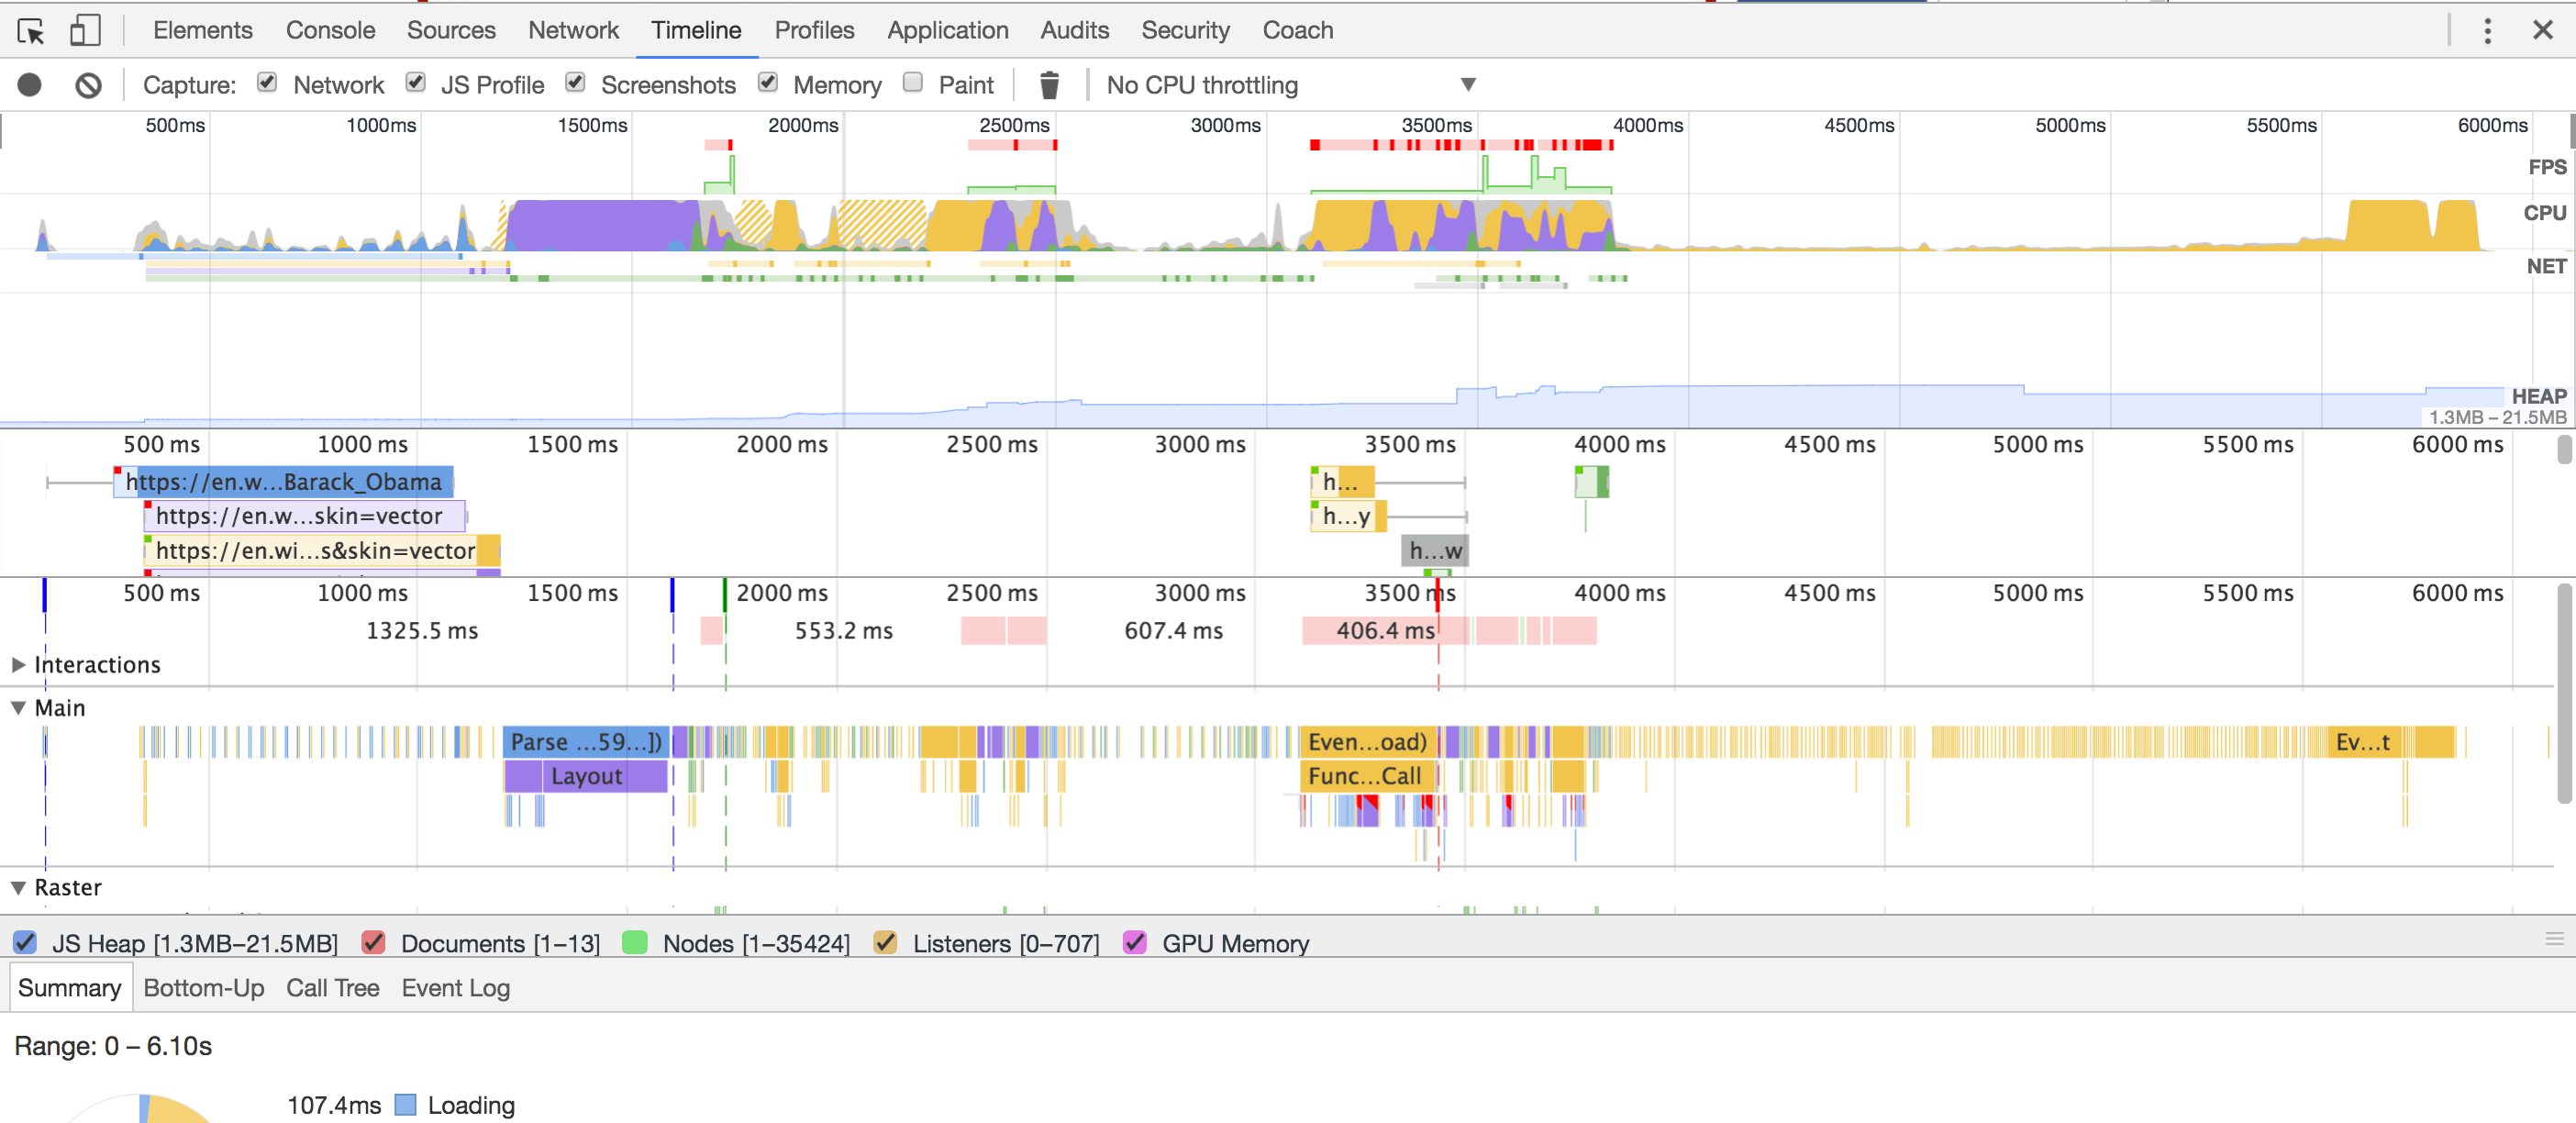
Get that timeline
You can now turn on the trace log for Chrome when you analyse a page. The trace log will be saved to disk and you can drag and drop it into the Timeline in Chrome. This also works if you run Chrome on your Android phone. We also added support for doing the same with WebPageTest (you could turn on Timeline before but we didn't automatically fetch it).
As an extra bonus, there's a Chrome trace message that is passed inside sitespeed.io when the trace is collected so your plugin can collect it and analyse the data. Look out from browsertime.chrometrace and webpagetest.chrometrace messages to pickup the trace. We are looking forward to the first plugin that will use it :)
Turn on the log with --browsertime.chrome.dumpTraceCategoriesLog, unpack the file and drop it in your timeline in dev-tools in Chrome.
One important thing: Collecting trace logs can affect your metrics if you run on a slow machine.
Easier to configure Chrome/Firefox
We added CLI options for setting Firefox preferences (--browsertime.firefox.preference) and Chrome browser CLI args (--browsertime.chrome.args).
Collect the HTML body in the HAR for Firefox
You can include the HTML in the HAR file by adding the flag --browsertime.firefox.includeResponseBodies so you can keep track of what is actually served from your server.
New and updated PerfCascade
PerfCascade is the cool SVG waterfall viewer we use and it's been updated with some UX fixes that makes it better and easier to use.
S3 fix: Set region
Thank you @jjethwa for the PR.
Bugfix: Fast forward to Chrome 57
There's a bug in Chrome 56 that we missed that caused our videos to contain orange frames. The metrics is ok as far as we know but the video looks wrong. We upgraded the Docker container to use latest Chrome 57 beta that solves the problem (in 4.5.1).
/Peter
P.S Read the full changelog for 4.5.0.