sitespeed.io 9.1 - Performance leaderboard
Grafana is the Open Source tool that just continues to give! In 6.2 there’s a new panel type that we used to create the new performance leaderboard. I’m pretty sure this is the best and most appealing way to compare performance between different pages.
Within the 9.1 release we have re-worked the dashboards and added the new leaderboard dashboard. It looks like this: 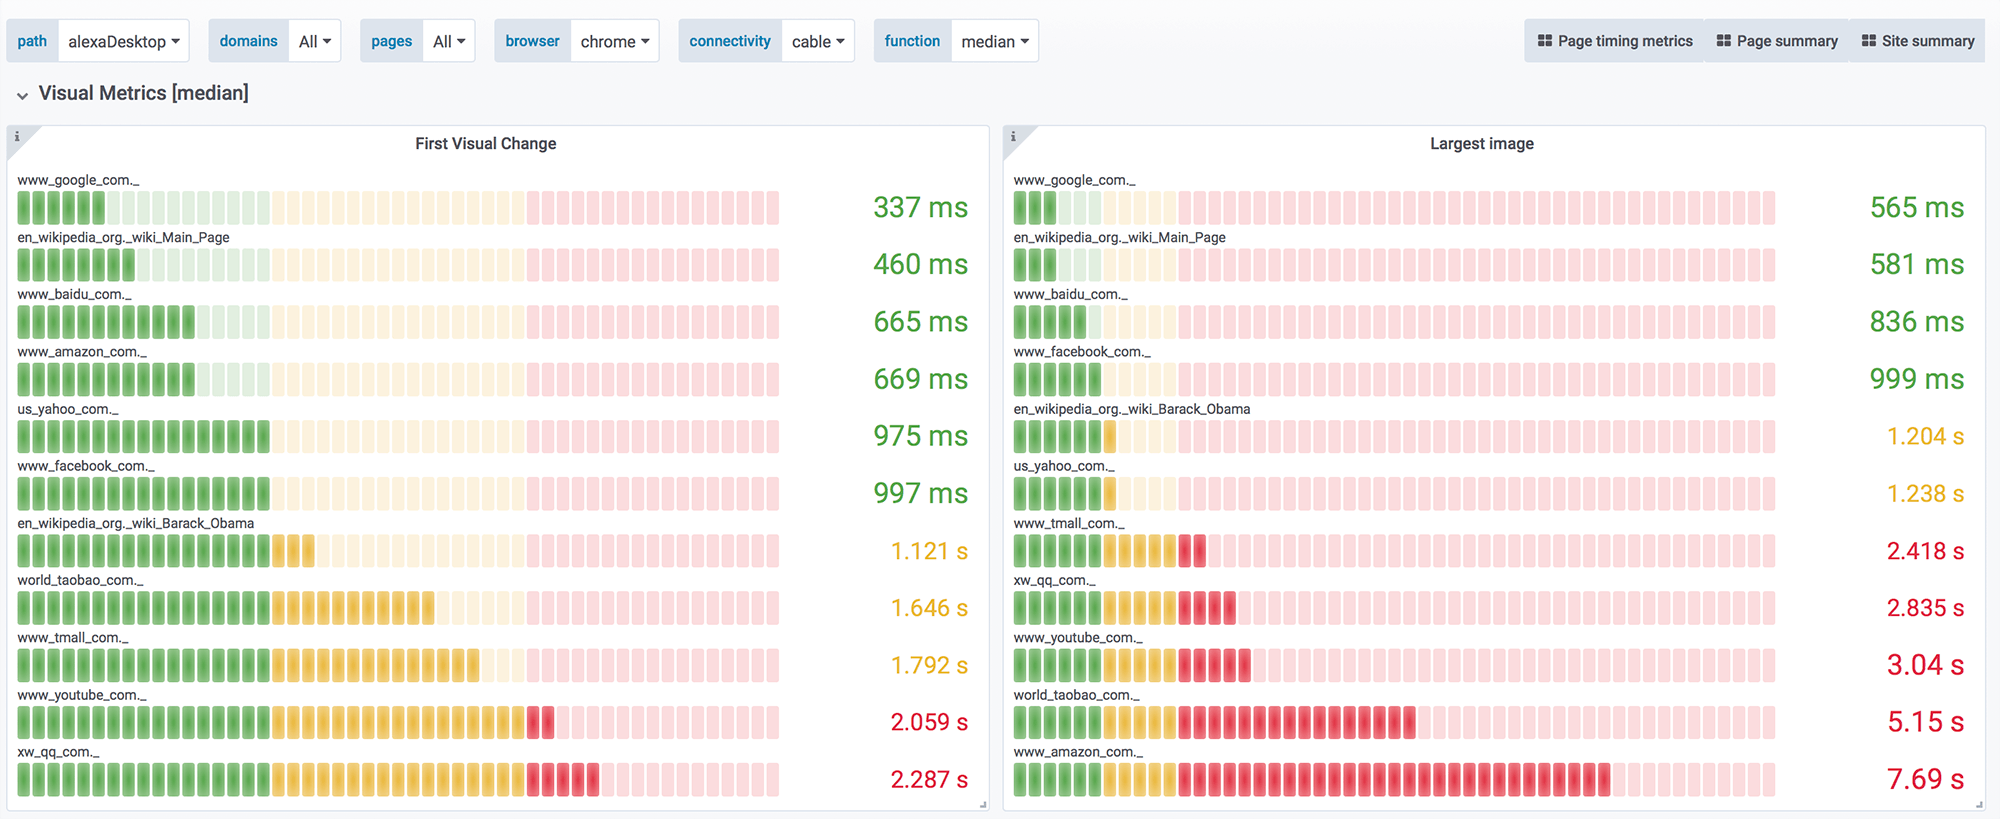
It helps communicate performance within you organisation. You can (and should) of course edit/change your own version of the dashboard:
- You can configure the red/yellow/green limits for each dashboard
- You can remove/add your own dashboards
- You can make each dashboard larger/smaller depending on how many URLs you wanna test
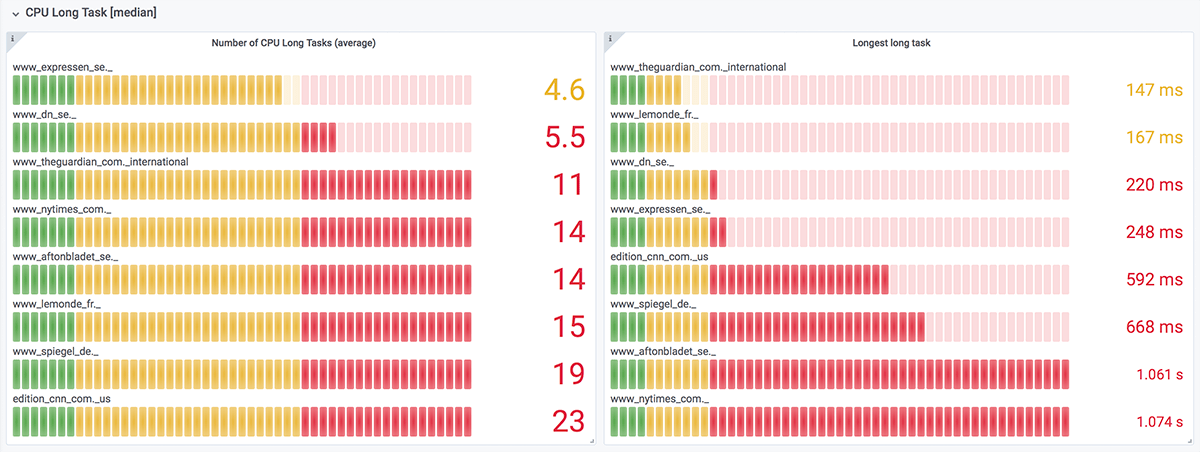
If you use Chrome to test you URLs you can see things like how many and how long CPU long tasks each page uses:
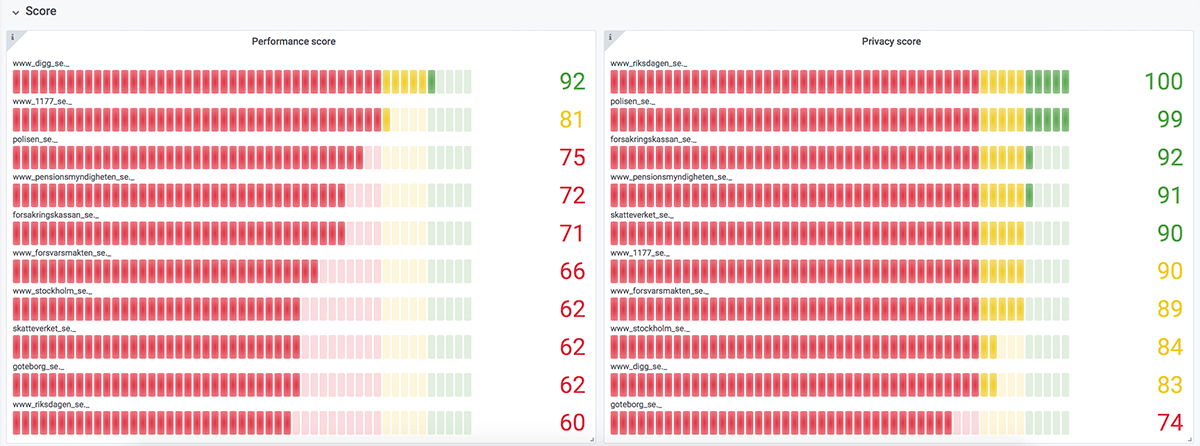
Or you can compare Coach performance and privacy score:
You can read more about the new leaderboard in the documentation.
We have some more changes and some bug fixes that you can read about in the changelog.
/Peter