sitespeed.io version 7.5
Today (the 10th of October) is six years ago we released sitespeed.io 1.0. A lot have changed (for the better) over the years and today we are doing release number 200!
New in 7.5 #
We have been collecting a couple of features and fixes over the last months that’s finally being released.
- Screenshots in Grafana annotations
- Annotations in Grafana (instead of Graphite/InfluxDB)
- Lighthouse support
- Collect timing metrics from visual elements
- Feed your own script with data
- Direct links to the summary page
- Inject JavaScript in your page as early as possible (in Firefox)
- More metrics
- Give your URL alias from the command line
- Using hash in the URL is now ok
- Updated dashboards
- Bug fixes
Screenshots in Grafana annotations #
You can include a screenshot from the run in the annotation by adding --graphite.annotationScreenshot to your configuration.
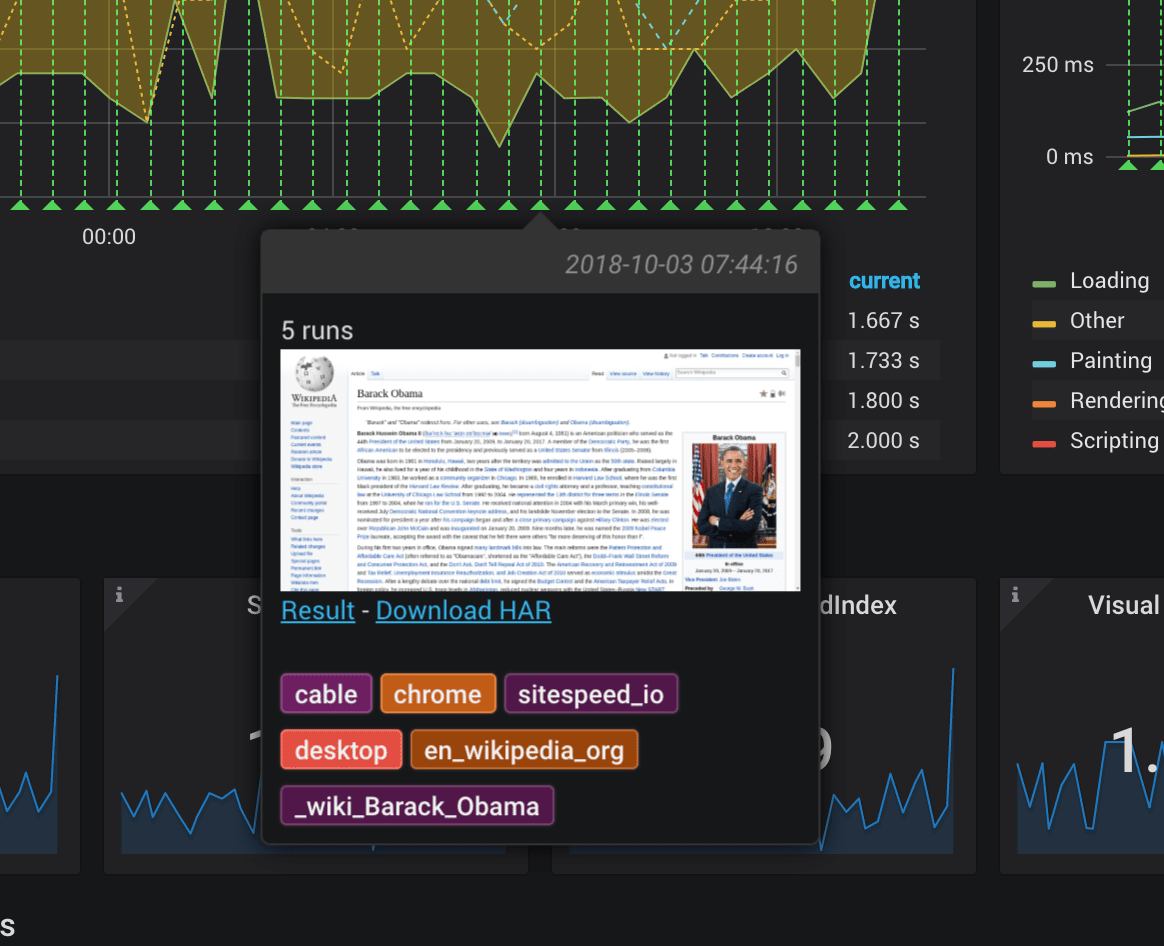
This bridges the gap between what you test and graph and actually seeing that page. It’s super helpful in some cases to really fast understand a change.
Annotations in Grafana (instead of Graphite/InfluxDB) #
Instead of using Graphite annotations you can use Grafana built in annotations since sitespeed.io 7.5 and Grafana 5.3.0.
To use Grafana annotations, make sure you setup a resultBaseURL and add the host and port to Grafana: --grafana.host and --grafana.port.
Everything will continue to work as before with this release and you can yourself choose to use the Grafana annotations. This is good since the annotations in Grafana will be independent of storage backend (you can use the annotations independently how you store your metrics) and in the future you can use Grafana built in functionality to remove old annotations.
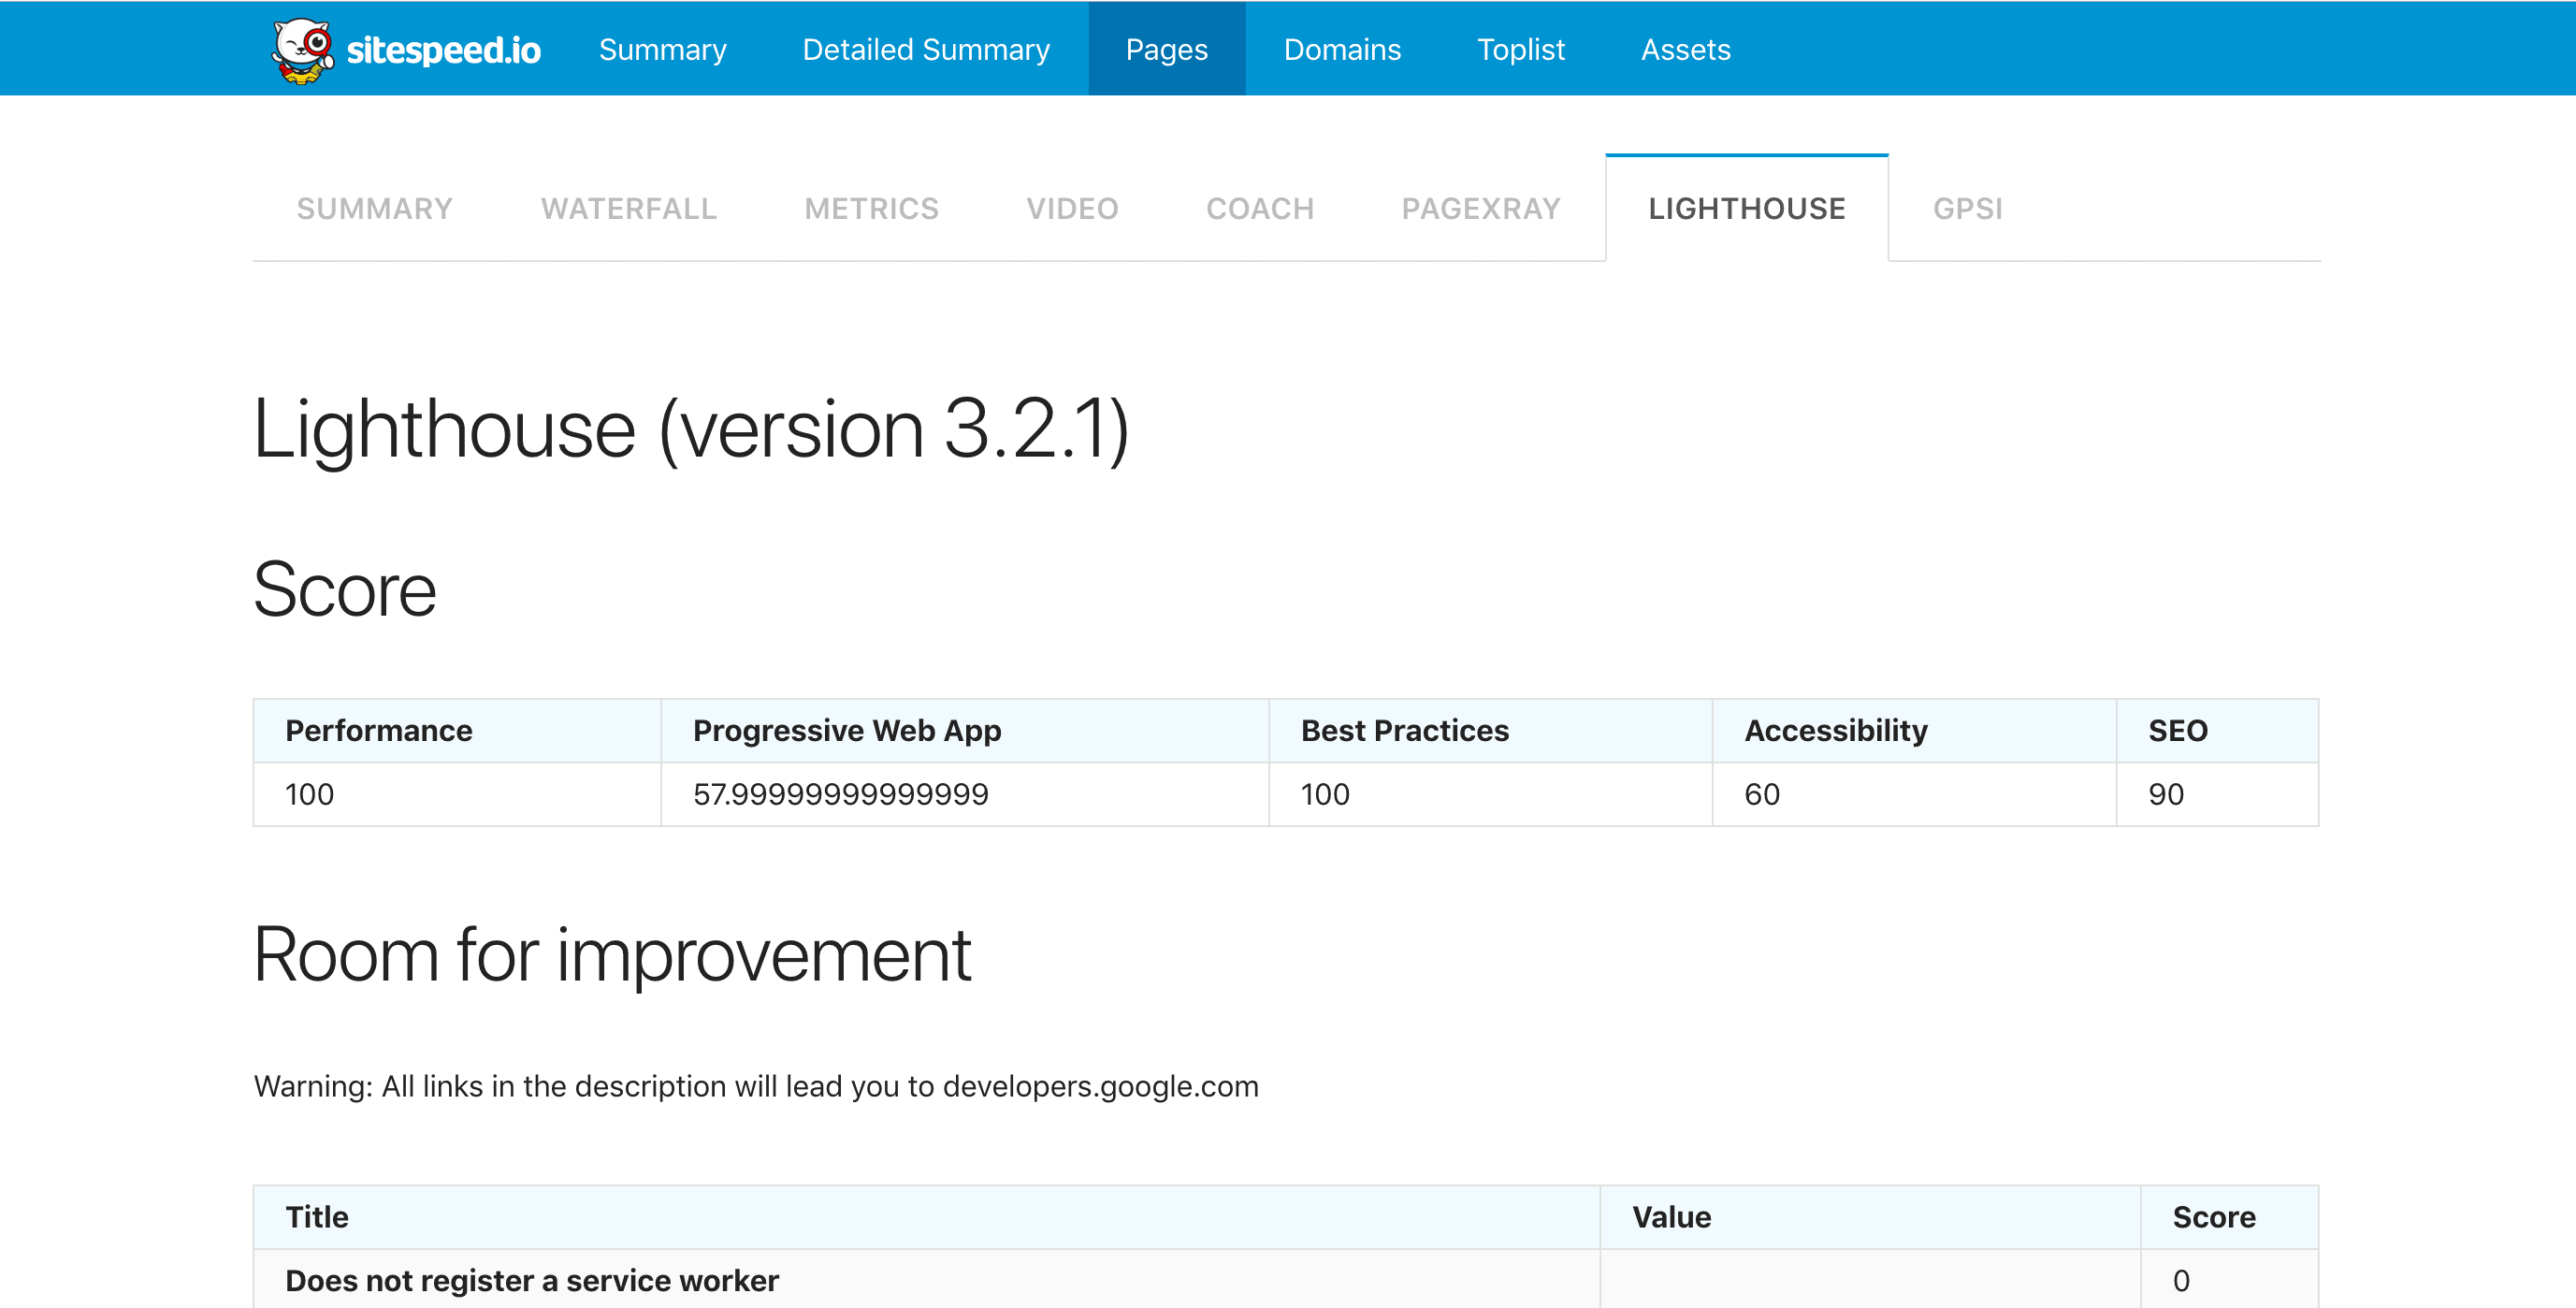
Lighthouse support #
We’ve been missing an plugin for Lighthouse for a long time. But now it’s time (thank you Lorenzo Urbini for sharing your version a long time ago).
You can find the plugin at https://github.com/sitespeedio/plugin-lighthouse and it will work with sitespeed.io 7.5 and later.
We also made it easy to use Lighthouse and the Google PageSpeed Insights plugin by releasing the +1 Docker container #2175!
You can run it with:
docker run --shm-size=1g --rm -v "$(pwd):/sitespeed.io" sitespeedio/sitespeed.io:7.5.0-plus1 https://www.sitespeed.io/
And you will also automatically run Lighthouse and GPSI. We will release a new version of the container per release by adding -plus1 to the tag. If you use Graphite/InfluxDb the score from Lighthouse and GPSI will be automatically stored.
This is a really simple implementatiom and if you miss any functionality please send PRs to https://github.com/sitespeedio/plugin-lighthouse and https://github.com/sitespeedio/plugin-gpsi.
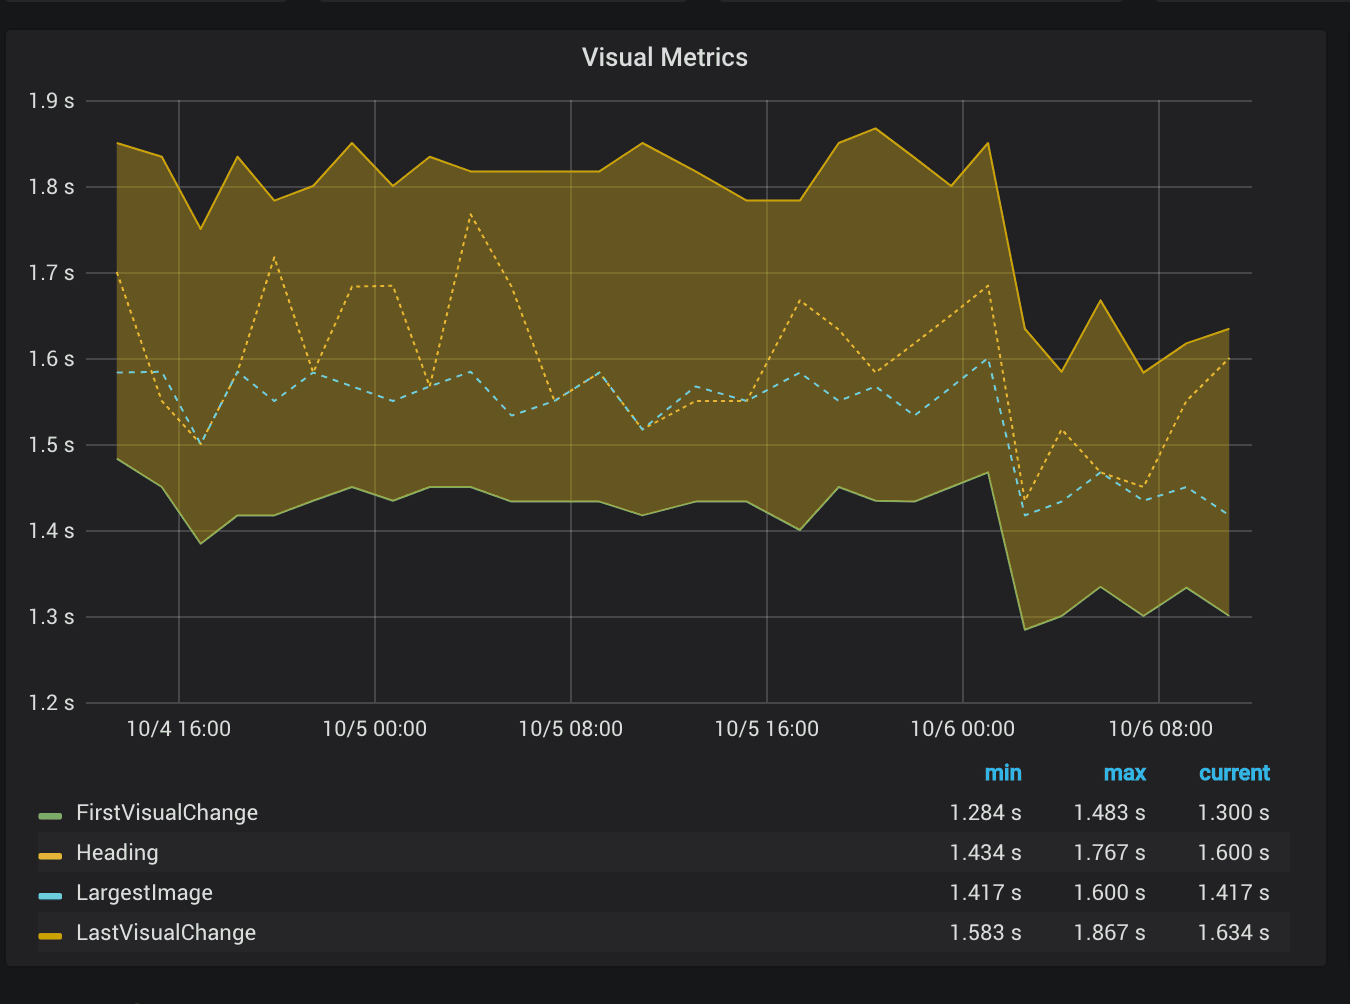
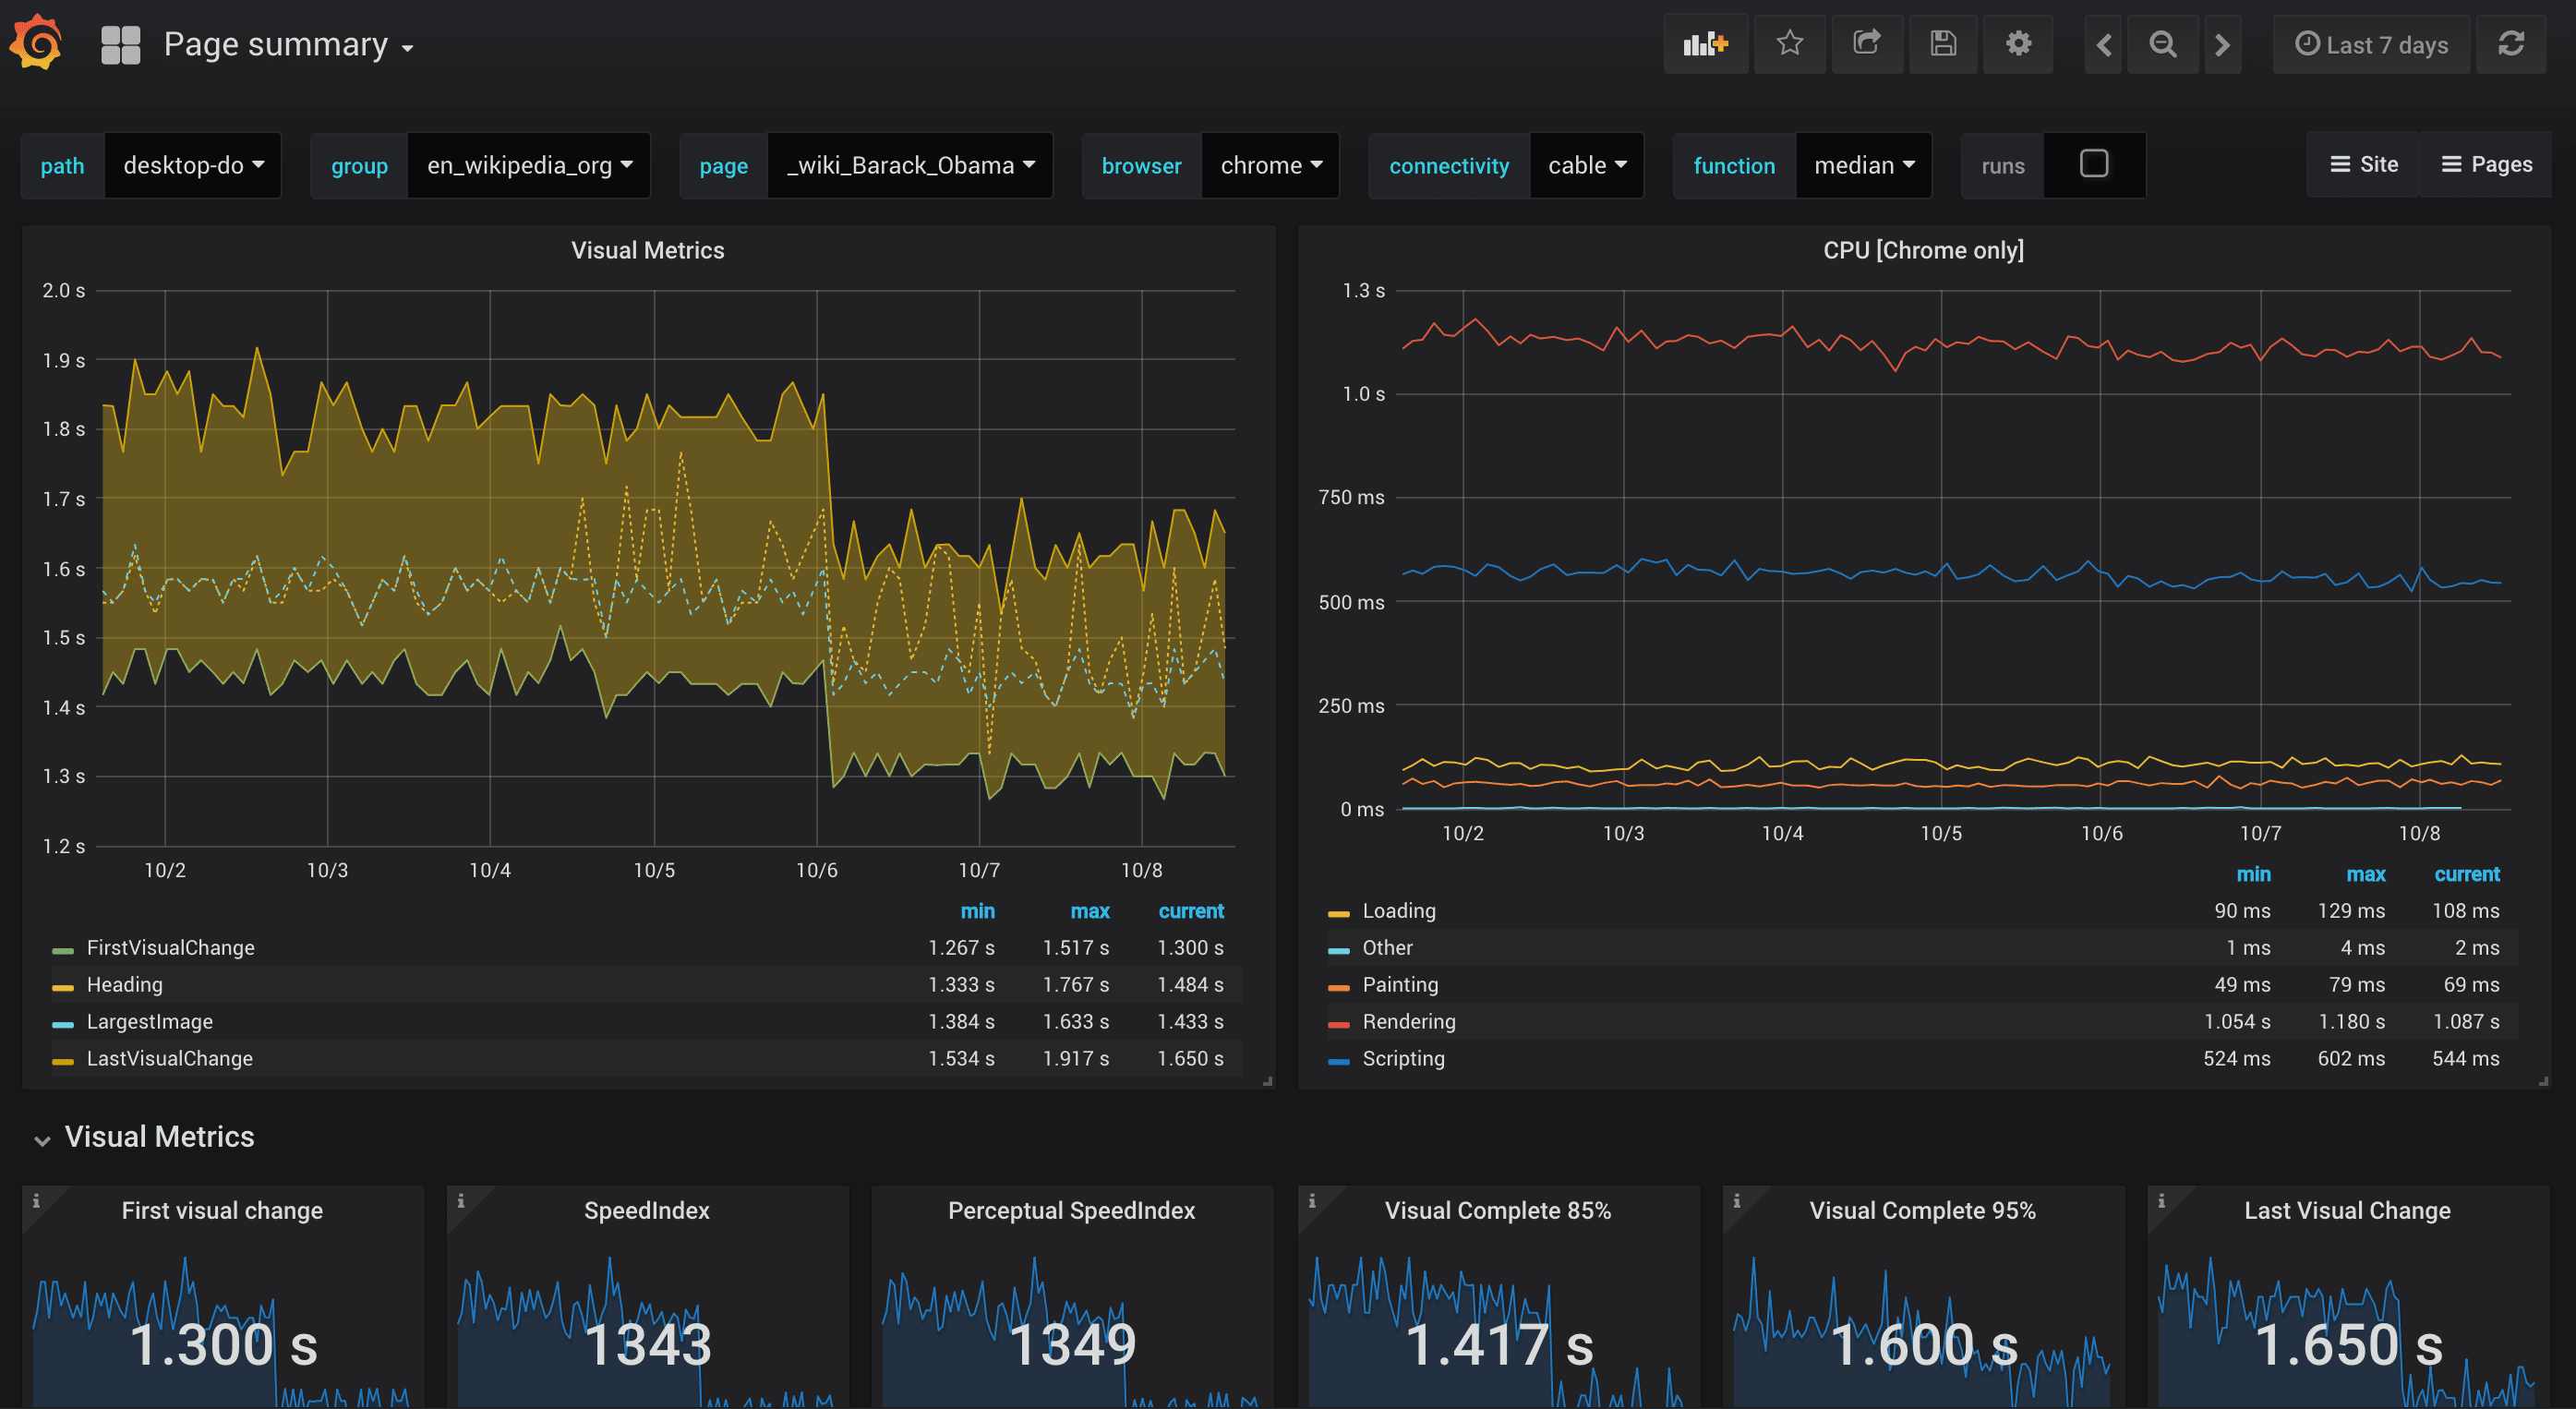
Collect timing metrics from visual elements #
We have upgraded Browsertime to the latest version and one of the new features are timings from visual elements. Try it by adding --visuaElements. Browsertime picks up the largest image and the largest H1. You can also configure your own elements --scriptInput.visualElements.
First let give credit to the ones that deserves it: As far as we know Sergey Chernyshev was the first one that introduced the idea of measuring individual elements in his talk Using Heat Maps to improve Web Performance Metrics. A couple of years later this was implemented by the Joseph Wynn of SpeedCurve, that later on contributed back the implementation to WebPageTest (calling it “hero”-elements). Patrick Meenan (the creator of WebPageTest) moved on the implementation to Visual Metrics that Browsertime uses to pickup visual metrics from the video. We removed the hero naming and now it’s ready to try out. There can still be bugs so please send issues/PRs our way if you see something strange.
You can choose to collect when visual elements are visible (and on their final position) on the screen. Turn on with --visualElement and collect Visual Metrics from elements. Works only with --visualMetrics turned on (default in Docker). By default you will get visual metrics from the largest image within the view port and the largest H1.
You can also configure to pickup your own defined elements with --scriptInput.visualElements. Give the element a name and select it with document.body.querySelector. Use it like this: --scriptInput.visualElements name:domSelector . Add multiple instances to measure multiple elements. Visual Metrics will use these elements and calculate when they are visible and fully rendered. These metrics will also be included in HAR file so you can look at the waterfall and see when elements are visual within the viewport.
Feed your own script with data #
We also added a new feature: If you run your own custom script you can now feed it with different input by using --browsertime.scriptInput.*. Say you have a script named myScript you can pass on data to it with --browsertime.scriptInput.myScript 'super-secret-string'. More about this in the documentation the coming weeks.
Direct links to the summary page #
When linking to a sitespeed.io result we include index.html in the URL, so that you can use storages that doesn’t automagically redirect from / to /index.html (a.k.a Digital Ocean storage).
Inject JavaScript in your page as early as possible (in Firefox) #
You can use --injectJs to inject JavaScript into the current page (only Firefox at the moment) at document_start. More info: https://developer.mozilla.org/docs/Mozilla/Add-ons/WebExtensions/API/contentScripts.
More metrics #
Browsertime collects the Firefox only metric timeToDomContentFlushed. It is also pushed to Graphite/InfluxDB by default. There are rumours saying that this metric will be better than time to non blank for some web sites.
All metrics in the Paint Timing API (First Paint and First Contentful Paint in Chrome) are also pushed to Graphite/InfluxDB by default.
All metrics are also reported with stddev (not only median stdev). This is good when you want to keep track of how stable metrics you have.
Give your URL alias from the command line #
You can give alias for URLs in the CLI with --urlAlias. The number of alias needs to match the number of URLs. If you add the cli parameter, it will override alias that you can give to an URL within a file #2133
Using hash in the URL is now ok #
We have been old and conservative in how we use # when creating URLs: From the beginning (6+ years ago) we always left out # from URLs when we decided if a URL is unique or not. Now you can choose yourself with --useHash #2142.
Updated dashboards #
There’s a new version of the page summary and page timing dashboards for Graphite, trying to make it easier to find regressions: https://github.com/sitespeedio/grafana-bootstrap-docker
Bug fixes #
Upgraded to Browsertime 3.7.0 that changed how Basic Auth is handled: We send a basic auth request header instead of using the build in Web Extension #2151.
Chrome in some case(s) generates a HAR with broken timings that caused sitespeed.io to log error and not being able to collect timings per domain #2159. Fixed by #2160.
We updated to PageXray 2.4.0 that correctly pick up mime types for video/audio/xml and pdf (that was missed before).
Updated to Coach 2.3.0 that fixes so that the CSS advice never can be a negative score.
Fixed the bug that made us show wrong video/screenshot on page summary#2169. Before we always showed the first screenshot/video. Now we show the median pick (so it correlates to the right waterfall and metrics tab).
There have been multiple problems with navigations with hash route see for example #2091. We fixed so we don’t get that error + Chrome 69 changed the internal trace log so it (at least on our side) seems to work better. Please report back if you still see issues.
Tech #
- You can now use markdown in the pug templates -
!{markdown.toHTML(value)}
Summary #
Checkout the full Changelog for all the changes.
/Peter