Say hello to 5.0
It was almost 6 months ago when we released 4.0 and to get that out was a lot of hard work. Not only did we add HTTP/2 support, but we also did a complete rewriting of everything to make it more modular. With that we needed to release 4.0, but everything wasn’t as refined as we wanted. One big piece we missed out on was the final touches on the HTML result pages. Fear not we have that now with 5.0! :)
But first lets check what we have added in the last months:
- Video with SpeedIndex/firstVisualChange/lastVisualChange and VisualComplete 85%. This is real SpeedIndex where we record a video of the screen and use VisualMetrics to analyse and get the metrics.
- Upload the HTML result to Amazon S3.
- A better way to set connectivity using Docker networks.
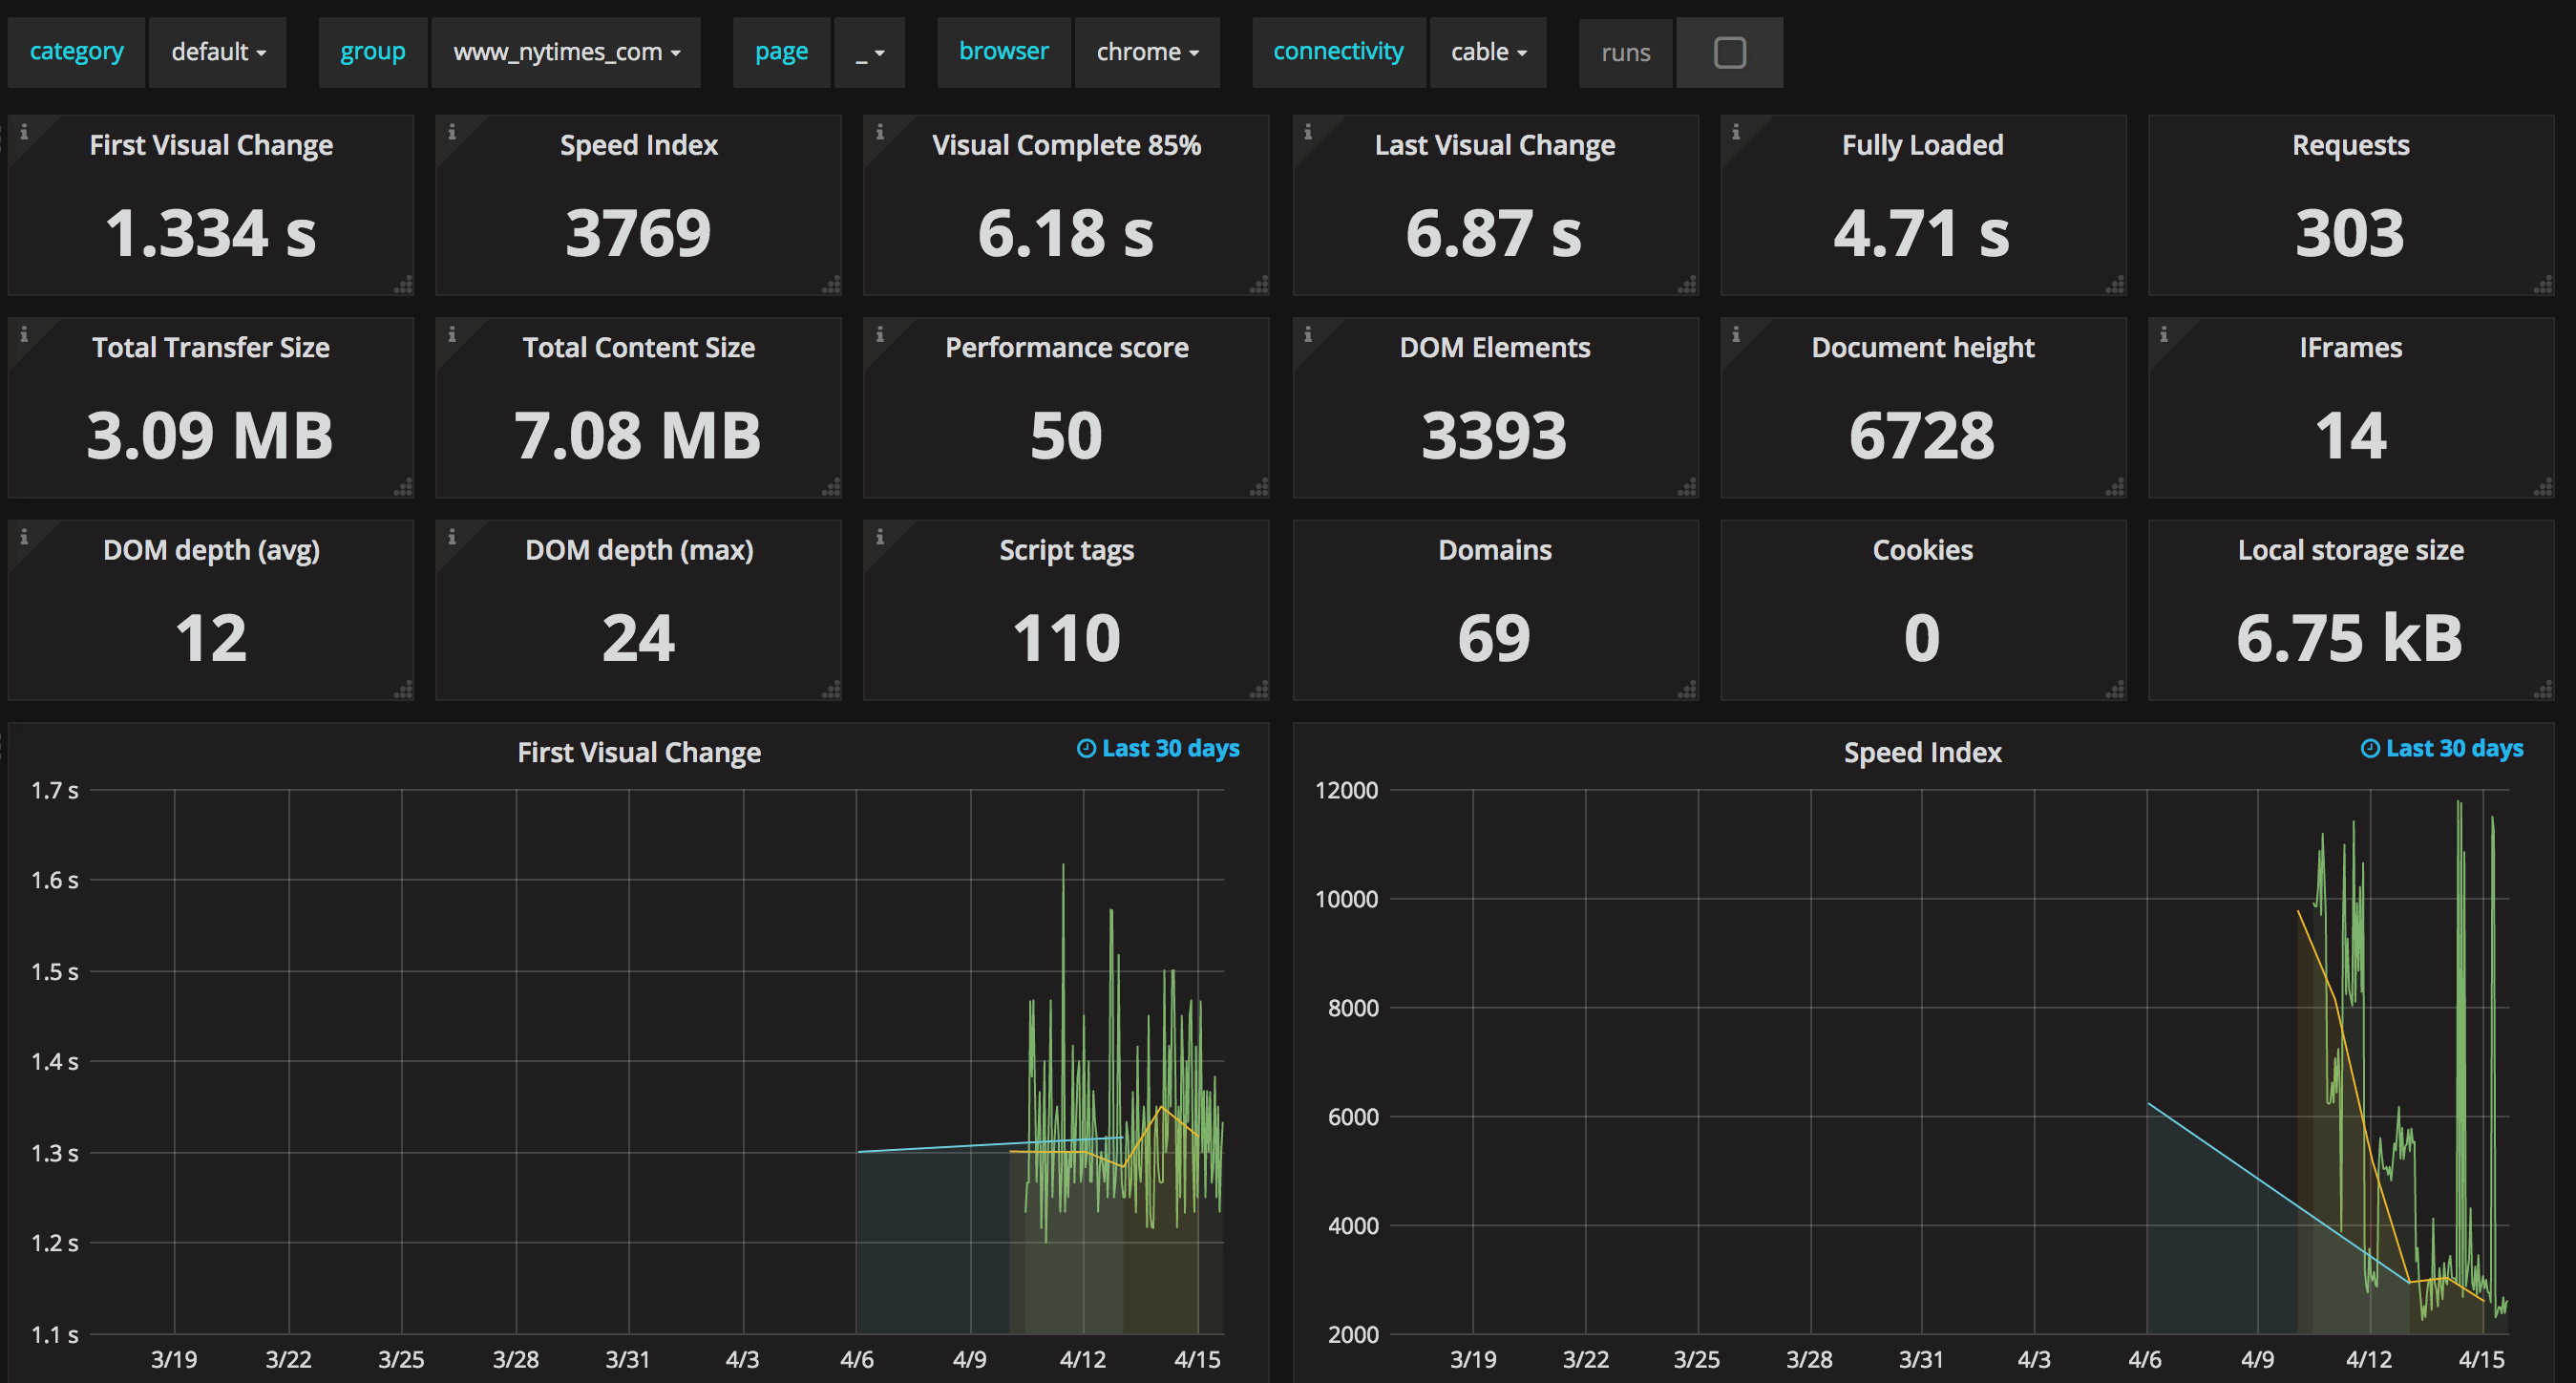
- Cleaner default Grafana dashboard with links to the HTML results.
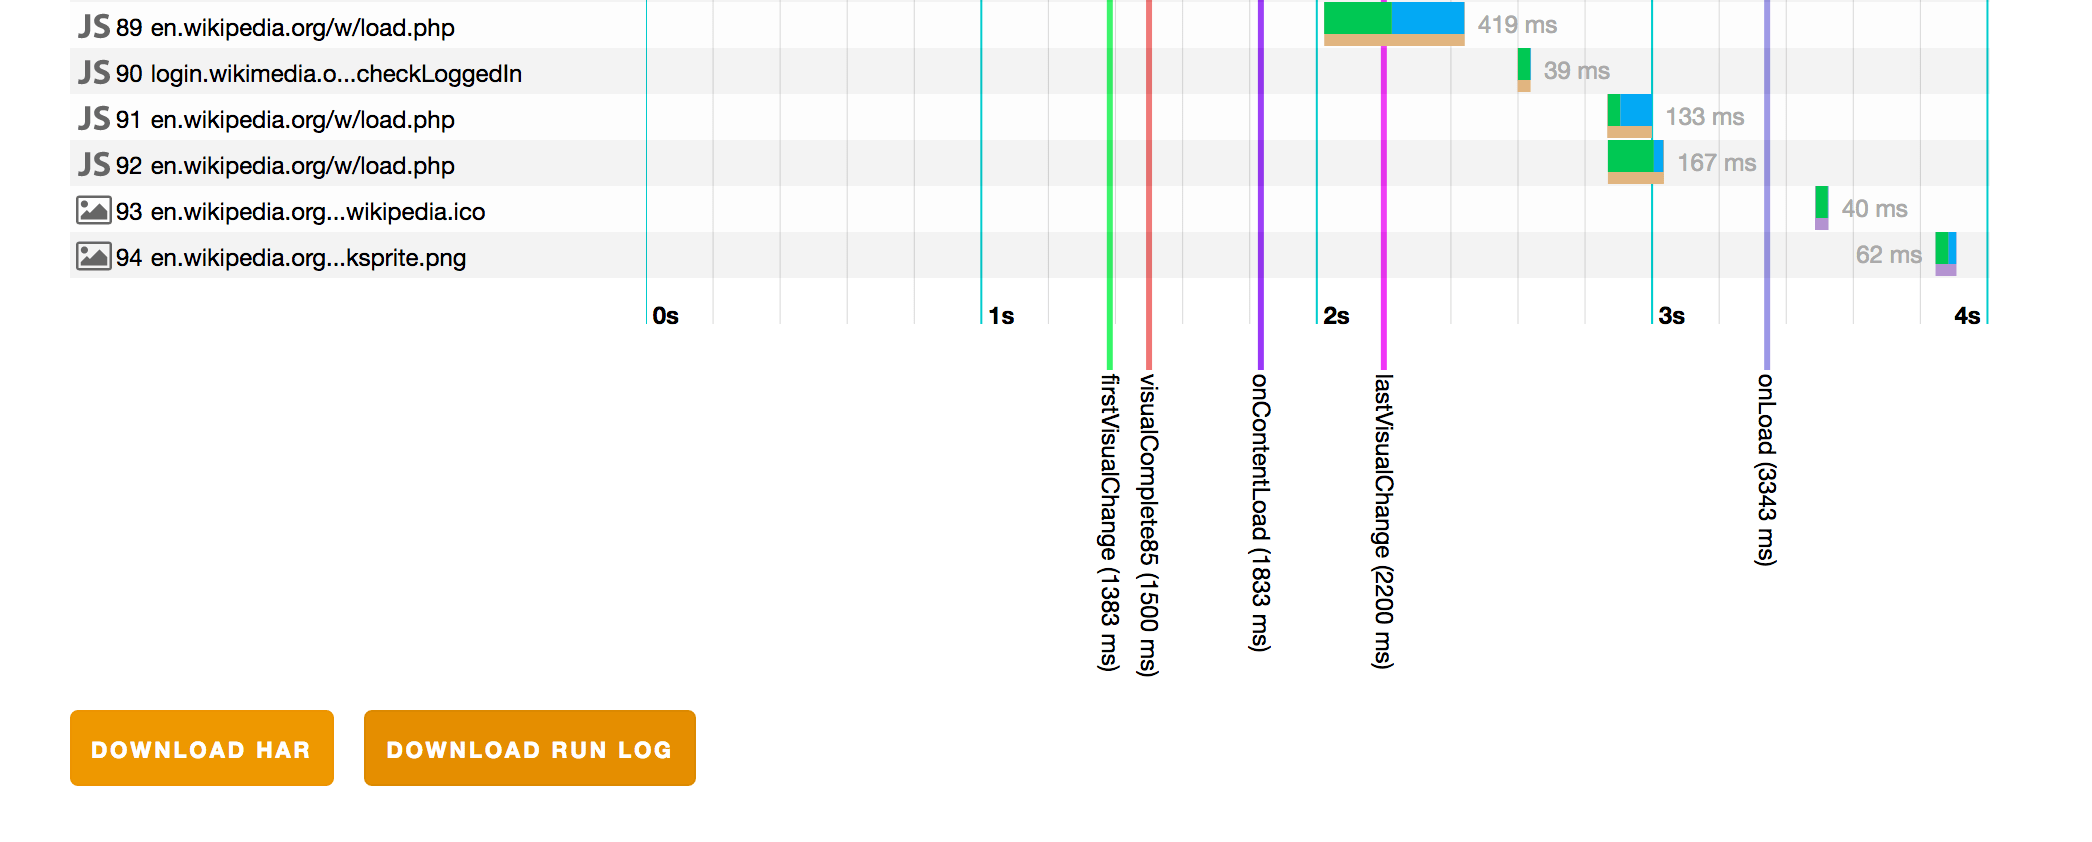
- A new and cleaner version of PerfCascade that makes the waterfall of the HAR files look that much better!
- Collection of the timeline log and netlog from Chrome.
Before we go on about the new things in 5.0 we wanna tell you about the status of the project: We have had more 500,000 downloads of sitespeed.io (611k + the ones we had before we moved to NodeJS and Docker)! We have a lot more things we want to add and we need your help more than ever!
We have a Slack channel for developers that you should join! This is the place you can get help with building plugins or contribute back to sitespeed.io. If you have questions on how to run sitespeed.io, please use GitHub issues.
Between the latest 4.7 and now 5.0 we have focused on getting the HTML mean and clean. Let’s check out the changed in 5.0.
UX improvements #
We have have re-structure the data and the whole experience using 5.0 is way better than 4.0! :)
Video #
If you have tried sitespeed.io since we first introduced video support you have seen that we have a really crisp video. One cool thing is that we display the visual metrics in the video when it happens. The video now also includes Visual Complete 85%, so it is easier to see when that happens compared to the other metrics.
We also made it easier to download the video. Checkout the yellow button for downloading. This now means you can download the video, the HAR files, Chrome timeline (if you configured that,) and the sitespeed.io log from each run. This is great if you have external tools that can leverage any of these files for alternative or additional analysis.
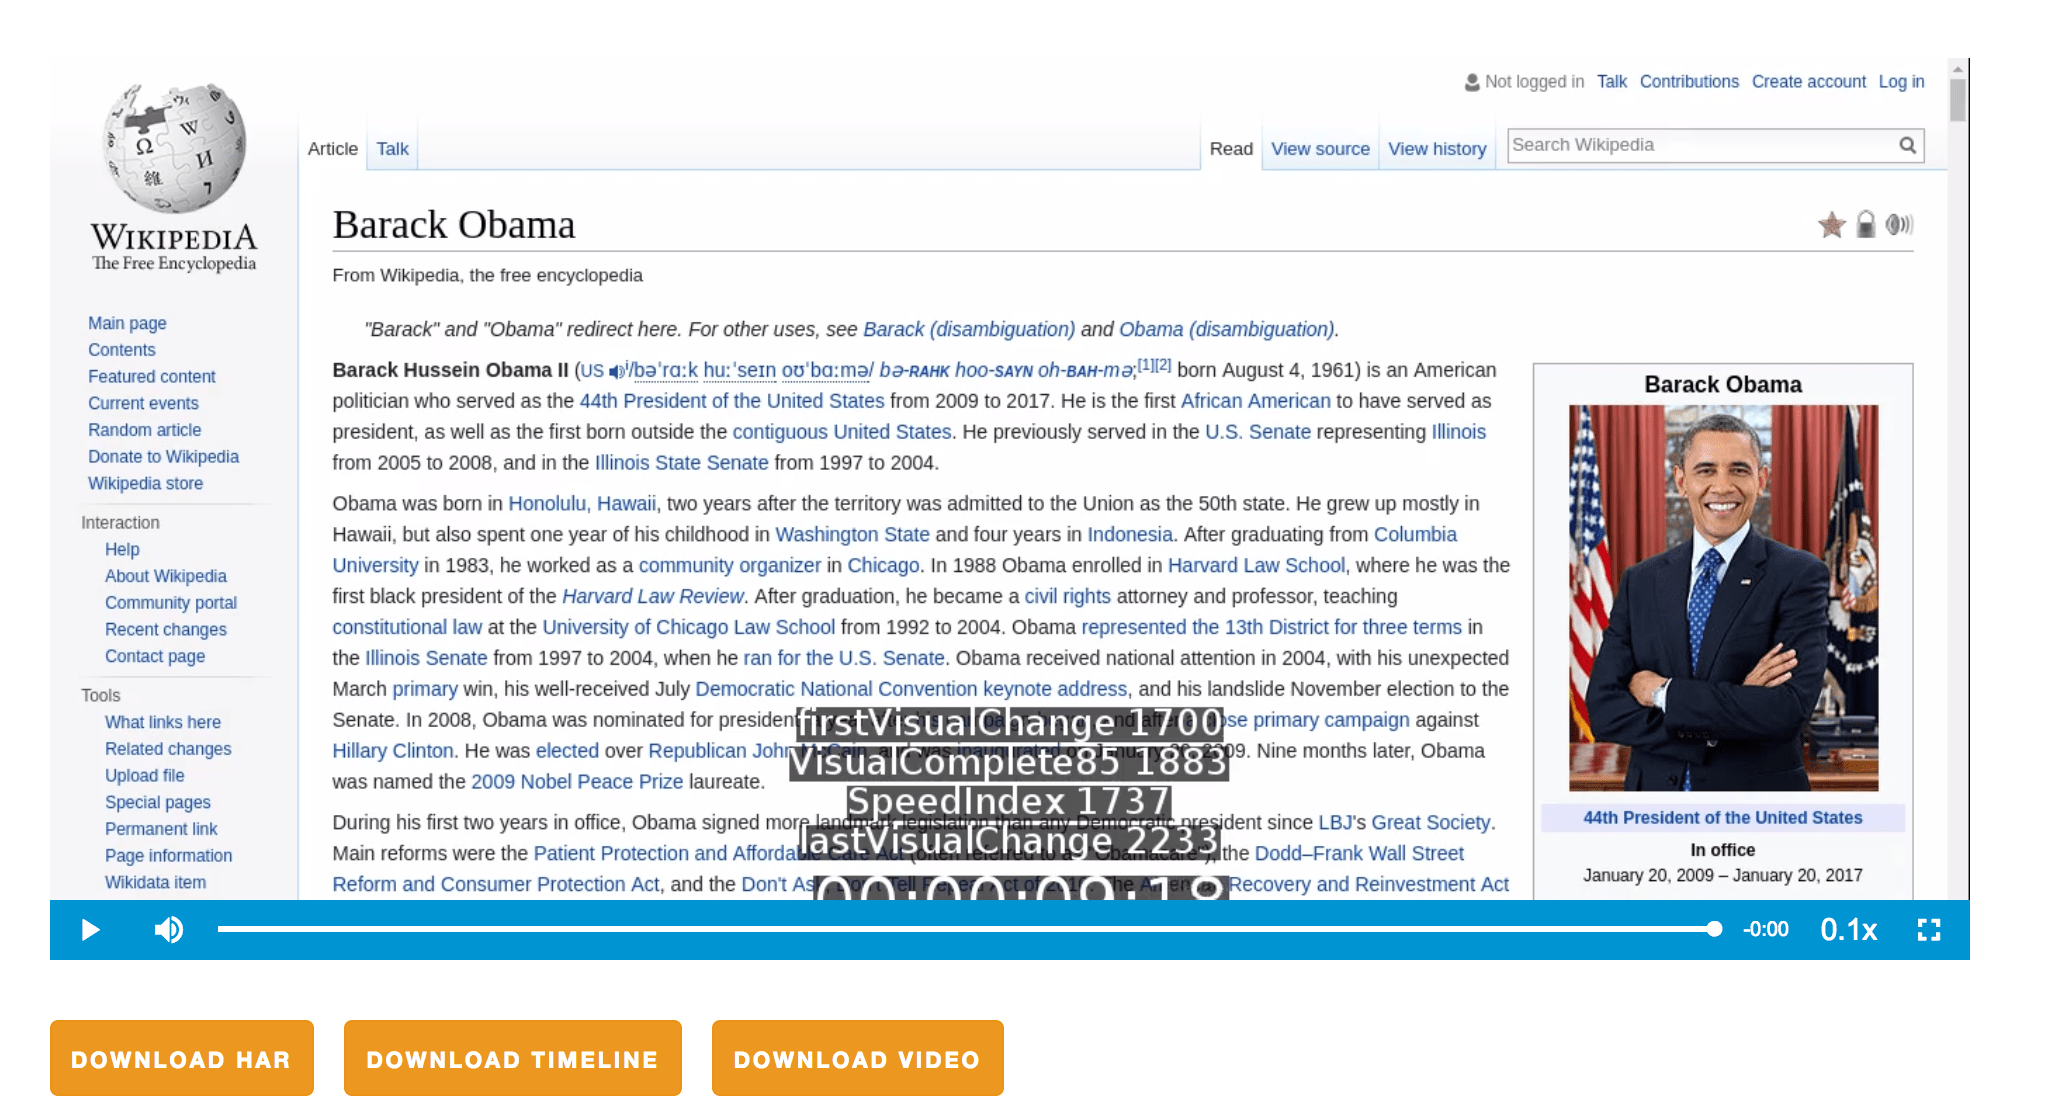
The video includes metrics by default, but you can turn that off if you want.
Timing metrics #
The Browsertime result page was a little hard to understand. To make this easier we have split the metrics in visual metrics and metrics from the browser.
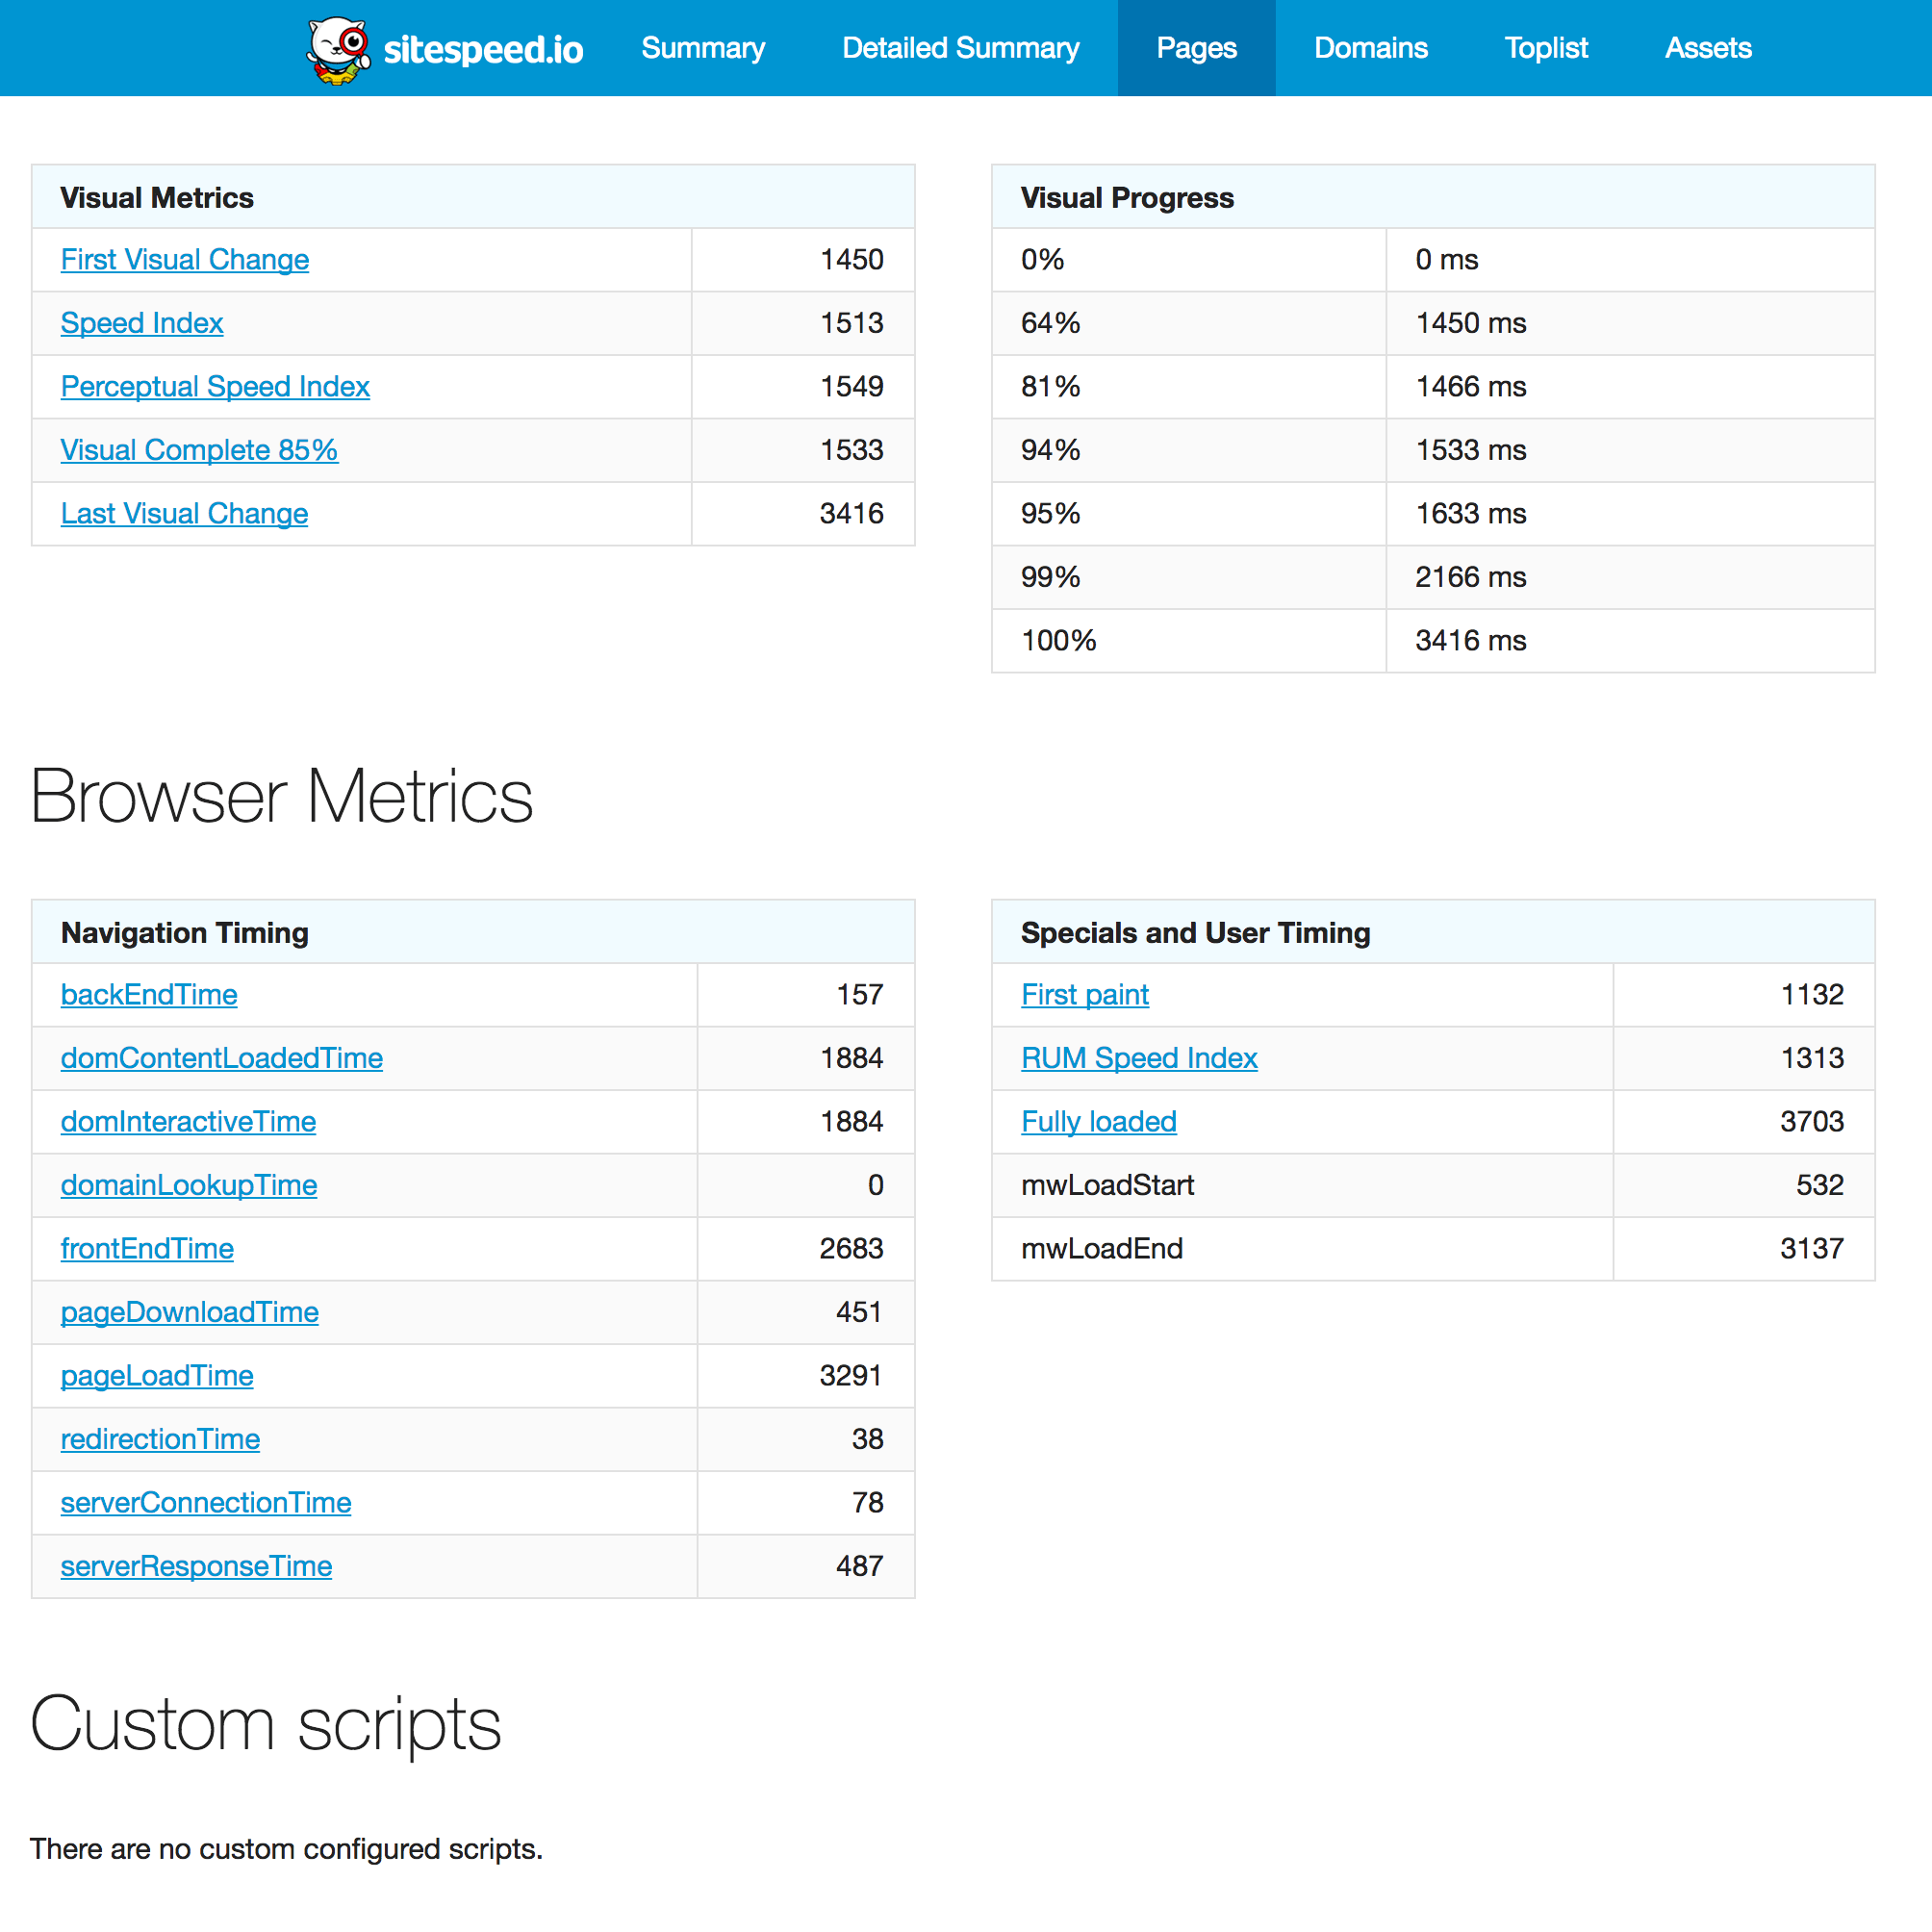
If you click on the metric you will get to the definition of the metric
Find that run #
On the page summary (where you see summary metrics for all runs) it is now really easy to match a metric to a specific run. All min/median/max metrics are linked to the run that hold it’s respective metric.
This is extremely useful if you are coming from Grafana and you want to match a specific run that was being graphed.
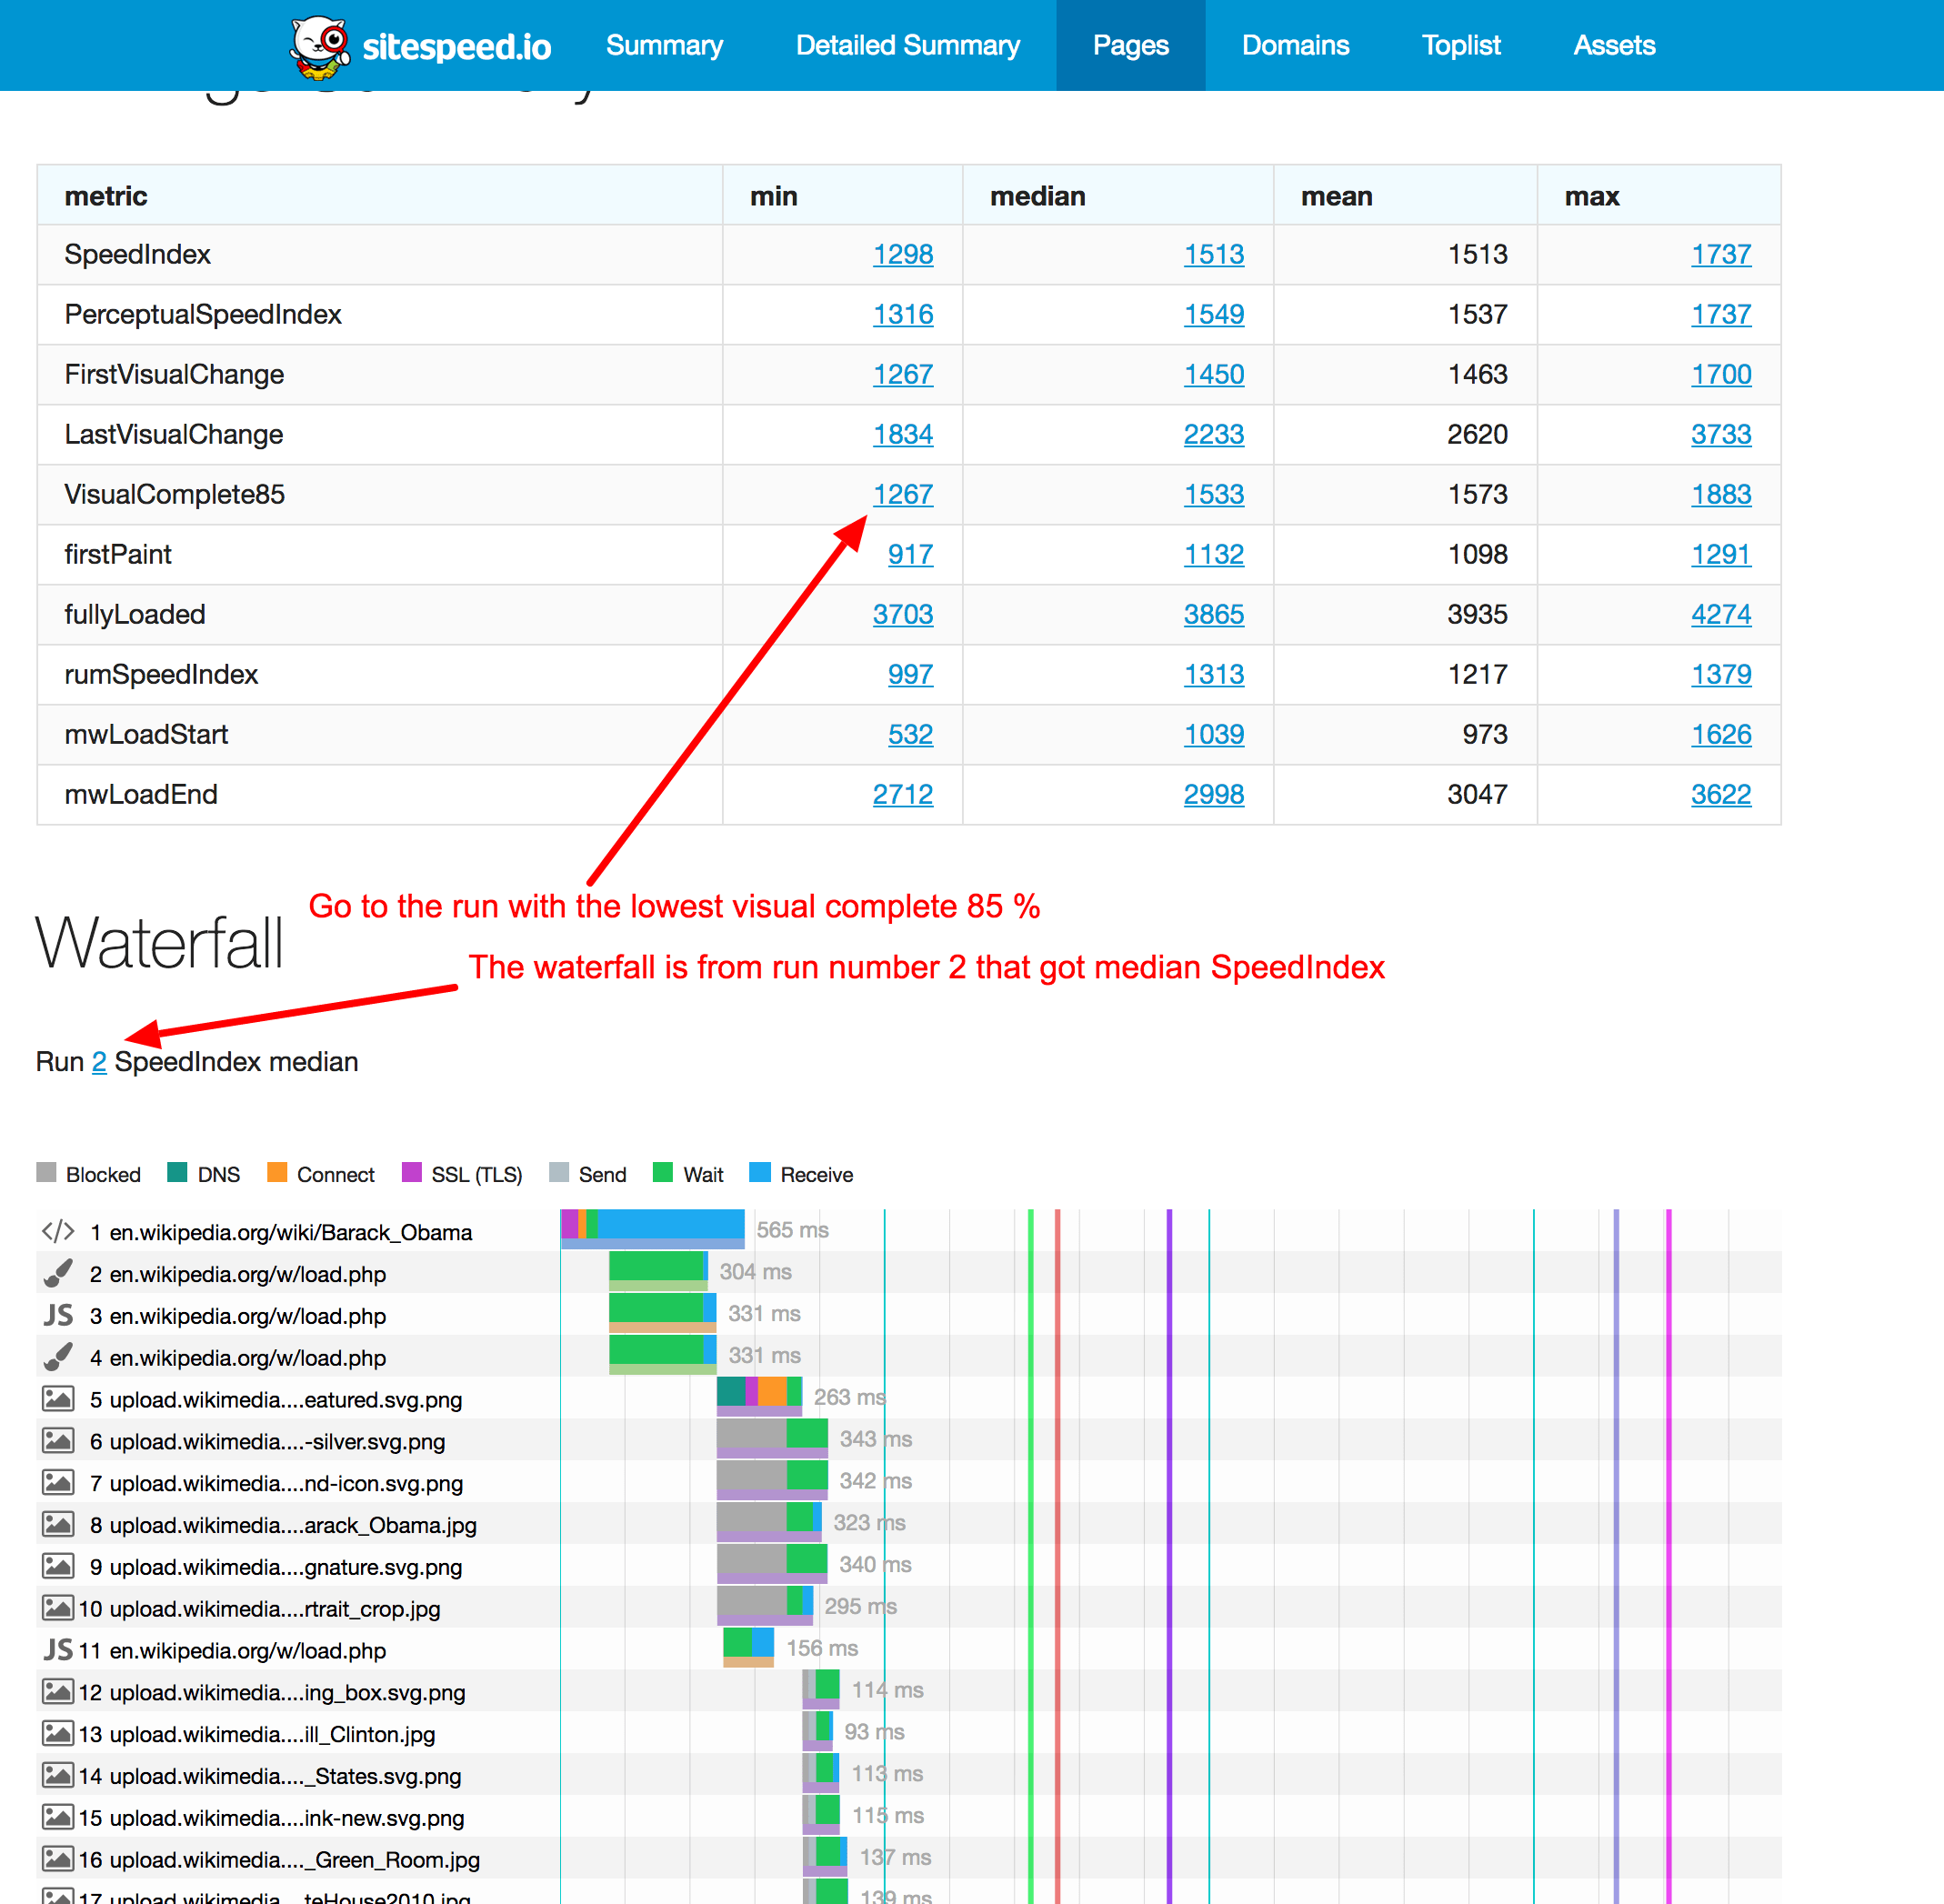
All metric numbers are now links, pointing to the run that had that specific metric
WebPageTest #
We are still in love with WebPageTest and have improved the look and feel of the WebPageTest result page. We also automatically download the HAR file, Chrome timeline JSON and the images for the waterfall graphs, so that the result is self contained. No more beacons back when your user accesses the result pages.
We show more metrics than before and also follow the structure of metrics that we use for Browsertime. 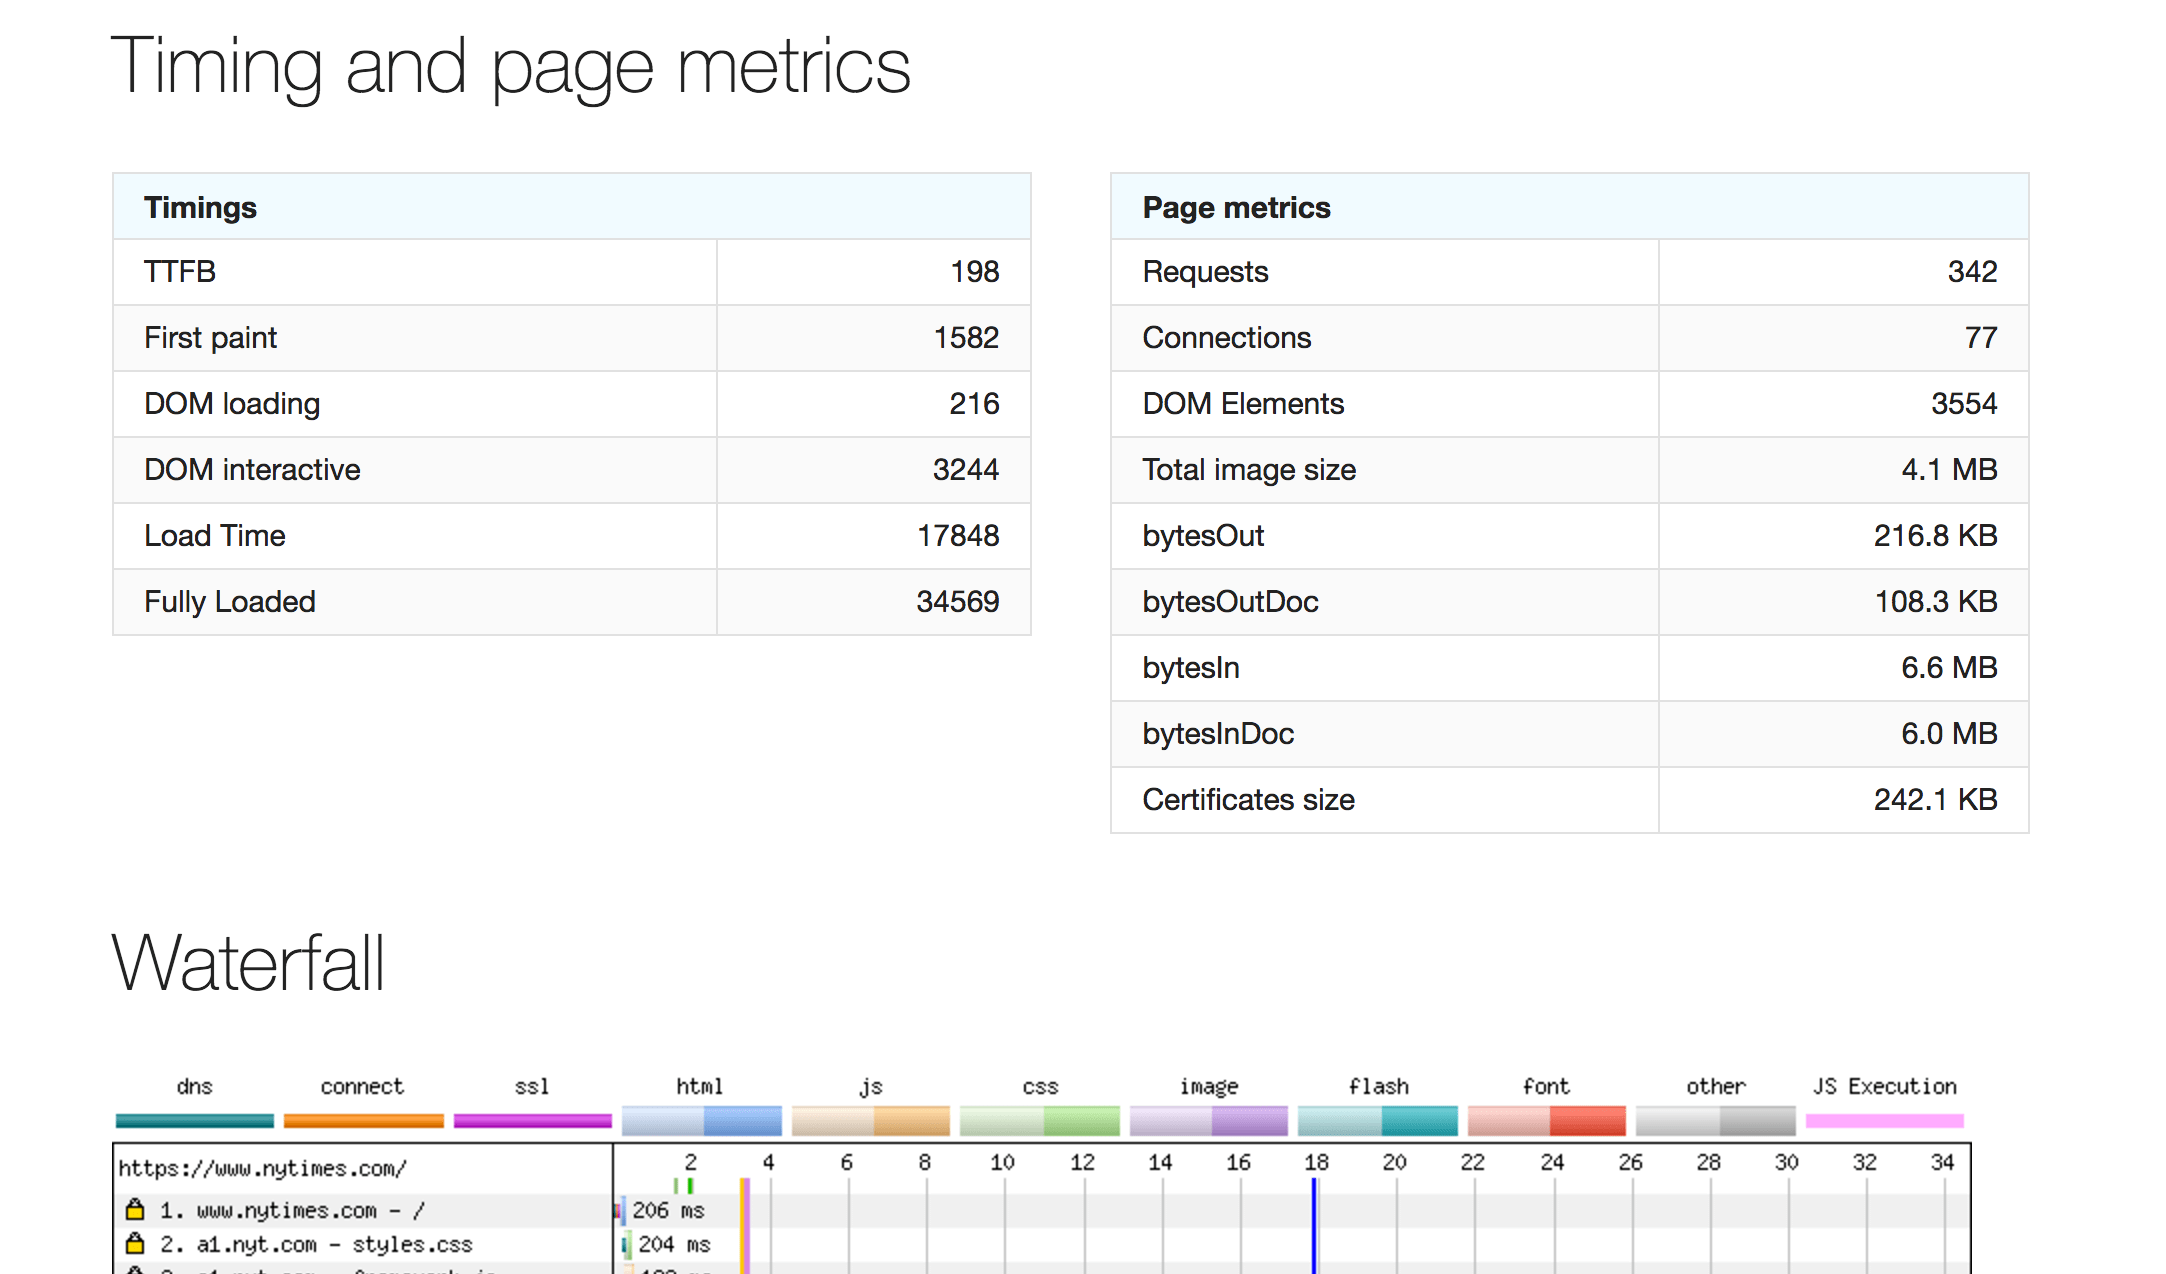
Logs #
As we mentioned earlier you can now download the logs easily from the HTML by adding --html.logDownloadLink to your CLI parameters.
InfluxDB #
We have had a long time goal to support one other TSDB than Graphite and we are happy to announce that we now officially support InfluxDB. We have one example dashboard that you can use and we will have more example dashboards in the future!
While this is extremely exciting it is also extremely new, so it could be miss out on functionality, if that’s the case, create an issue and help us make this support just as good as graphite!
A special thank you to @theist and @eripa who helped us fix the InfluxDB integration so the structure is better than we had in the original version.
Browsertime 1.1 #
Sitespeed.io 5.0 uses Browsertime 1.1 that we released yesterday. What a ride it has been for the first 1.0 beta just eight months ago to now at 1.1! We will soon release a blog post about 1.1, but I want to talk about some of the latest features we added before releasing this final version.
Video and SpeedIndex from your Android device #
While still in experimental support for video and SpeedIndex for Chrome on Android we need help to test it out on different devices. Right now you need to setup the dependencies needed for VisualMetrics yourself, so it some work to get that going. Check out the how to on what you need to setup.
Warning: This is really addictive! When I integrated the latest Browsertime in sitespeed.io I got stuck for a couple of hours testing different sites on my low end Huawei Android phone.
Our Docker container does not currently support Android at the moment, but we hope we can add it in the future. Let us know if you have any experience and can help us with that!
Your own request headers and the ability to block request #
We have finally been able to add support for your own request headers as well as blocking requests by domain, via creating our own Browser extension. In this release it works in Chrome and will soon in Firefox (we need a fix from Tobias to land in Selenium for supporting the new extension layout in Firefox). In the meantime here are a few examples with chrome on setting request headers or blocking requests.
Adding a request header:
docker run --shm-size=1g --rm -v "$(pwd):/sitespeed.io" sitespeedio/sitespeed.io https://www.sitespeed.io/ -r Name:Value
Blocking all request on my.example.com:
docker run --shm-size=1g --rm -v "$(pwd):/sitespeed.io" sitespeedio/sitespeed.io https://www.sitespeed.io/ --block my.example.com
Non backward compatible changes in 5.0 #
We try extremely hard to not break backwards compatibility where we can but, there is one change in 5.0 that has and it’s around network throttling and the default behavior: With Sitespeed.io standalone TSProxy is no longer the default for connectivity, since it doesn’t work as well as we wanted together with Selenium. We have also removed tc as the default when running with Docker. If you want to change connectivity with Docker you should use the new Docker network setup!
/Peter