sitespeed.io 10.0 - better than ever
I’m really proud to announce that we just shipped Browsertime 6.0 and sitespeed.io 10.0! It is almost seven years ago (the 12th of October 2012) since we shipped the first version of sitespeed.io!
So what’s new in the latest version?
- Accessibility testing using AXE
- New metrics in Chrome 77
- Test using Safari (OS X/iOS)
- More love for WebPageTest
- Dashboards updated
- Run your tests on Kubernetes
- Breaking changes
- Other new functionality and fixes
Accessibility testing using AXE #
With the new release you can automate parts of your accessibility testing using Axe. You can enable Axe tests with --axe.enable. It will run after all other metrics is collected.
docker run --rm -v "$(pwd):/sitespeed.io" sitespeedio/sitespeed.io:37.9.0 --axe.enable https://www.sitespeed.io
It will generate a new result tab in the page summary HTML, where you can see on a high level all violations: 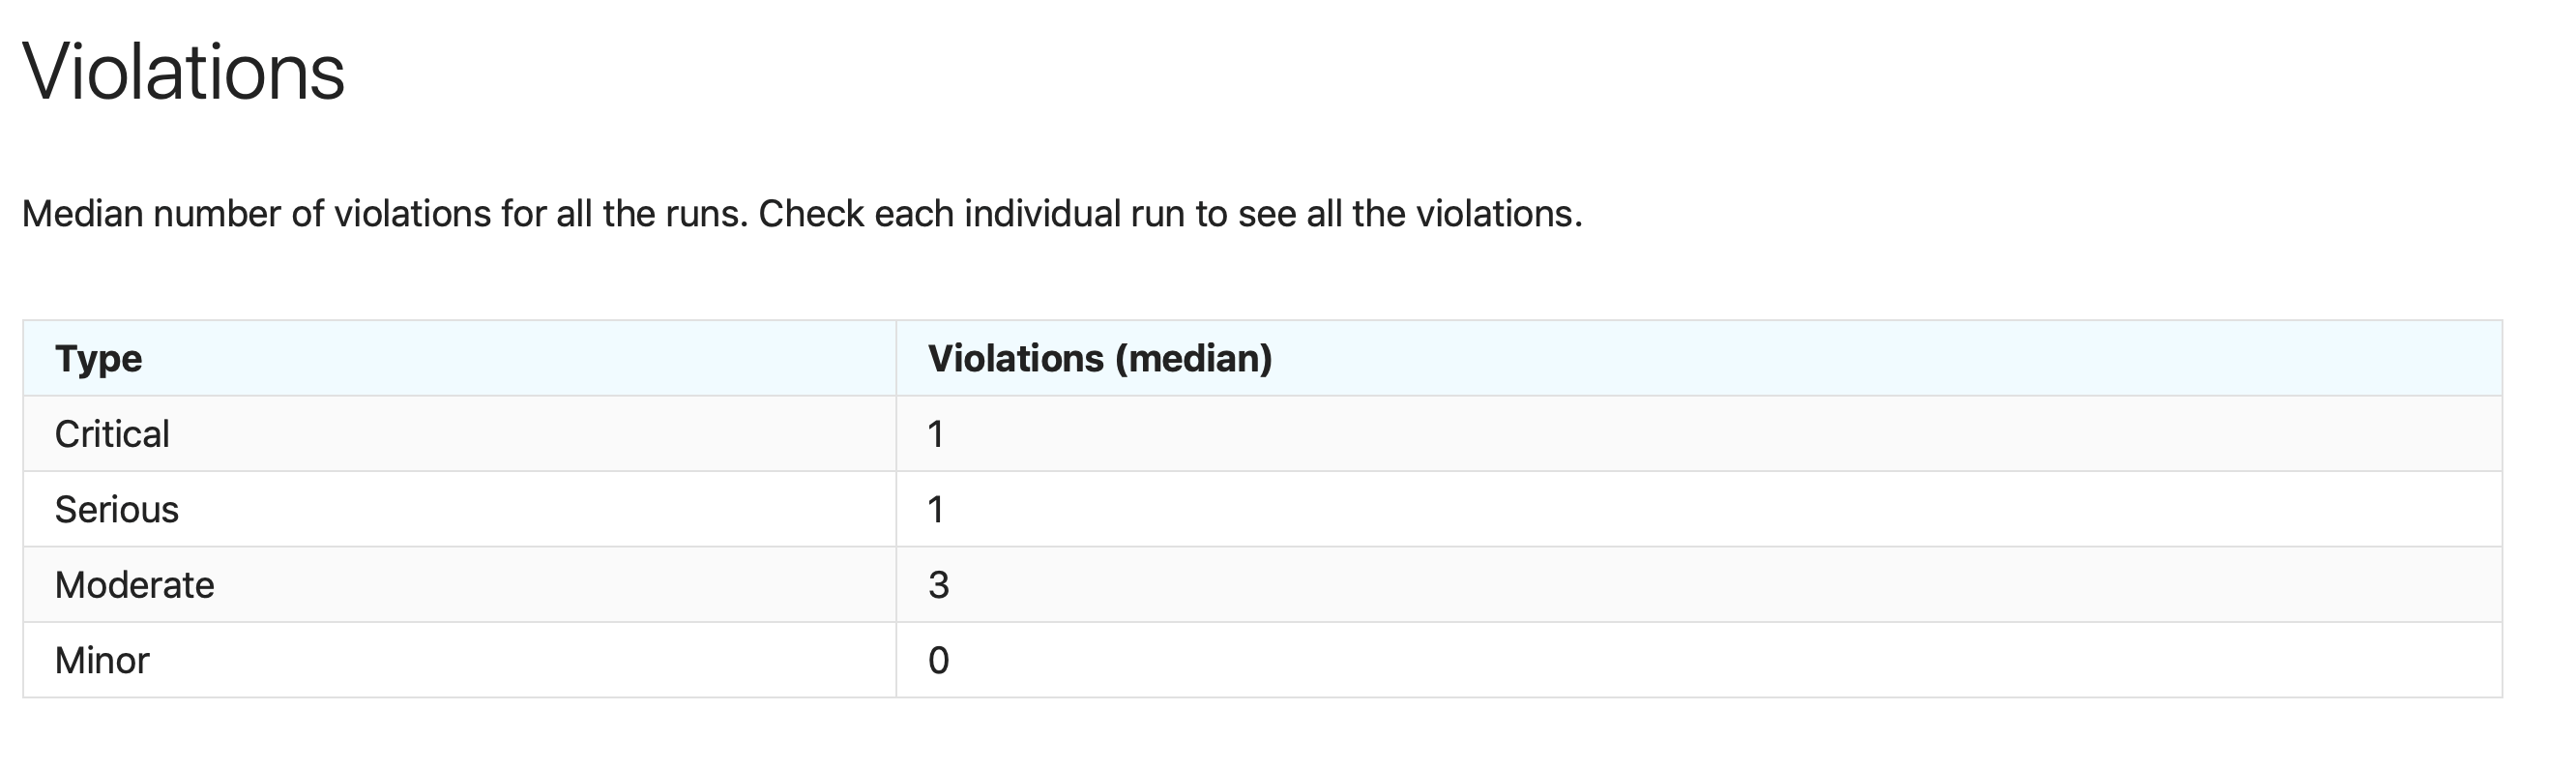
And then you can go to an individual run to see more indepth information (that you can act upon): 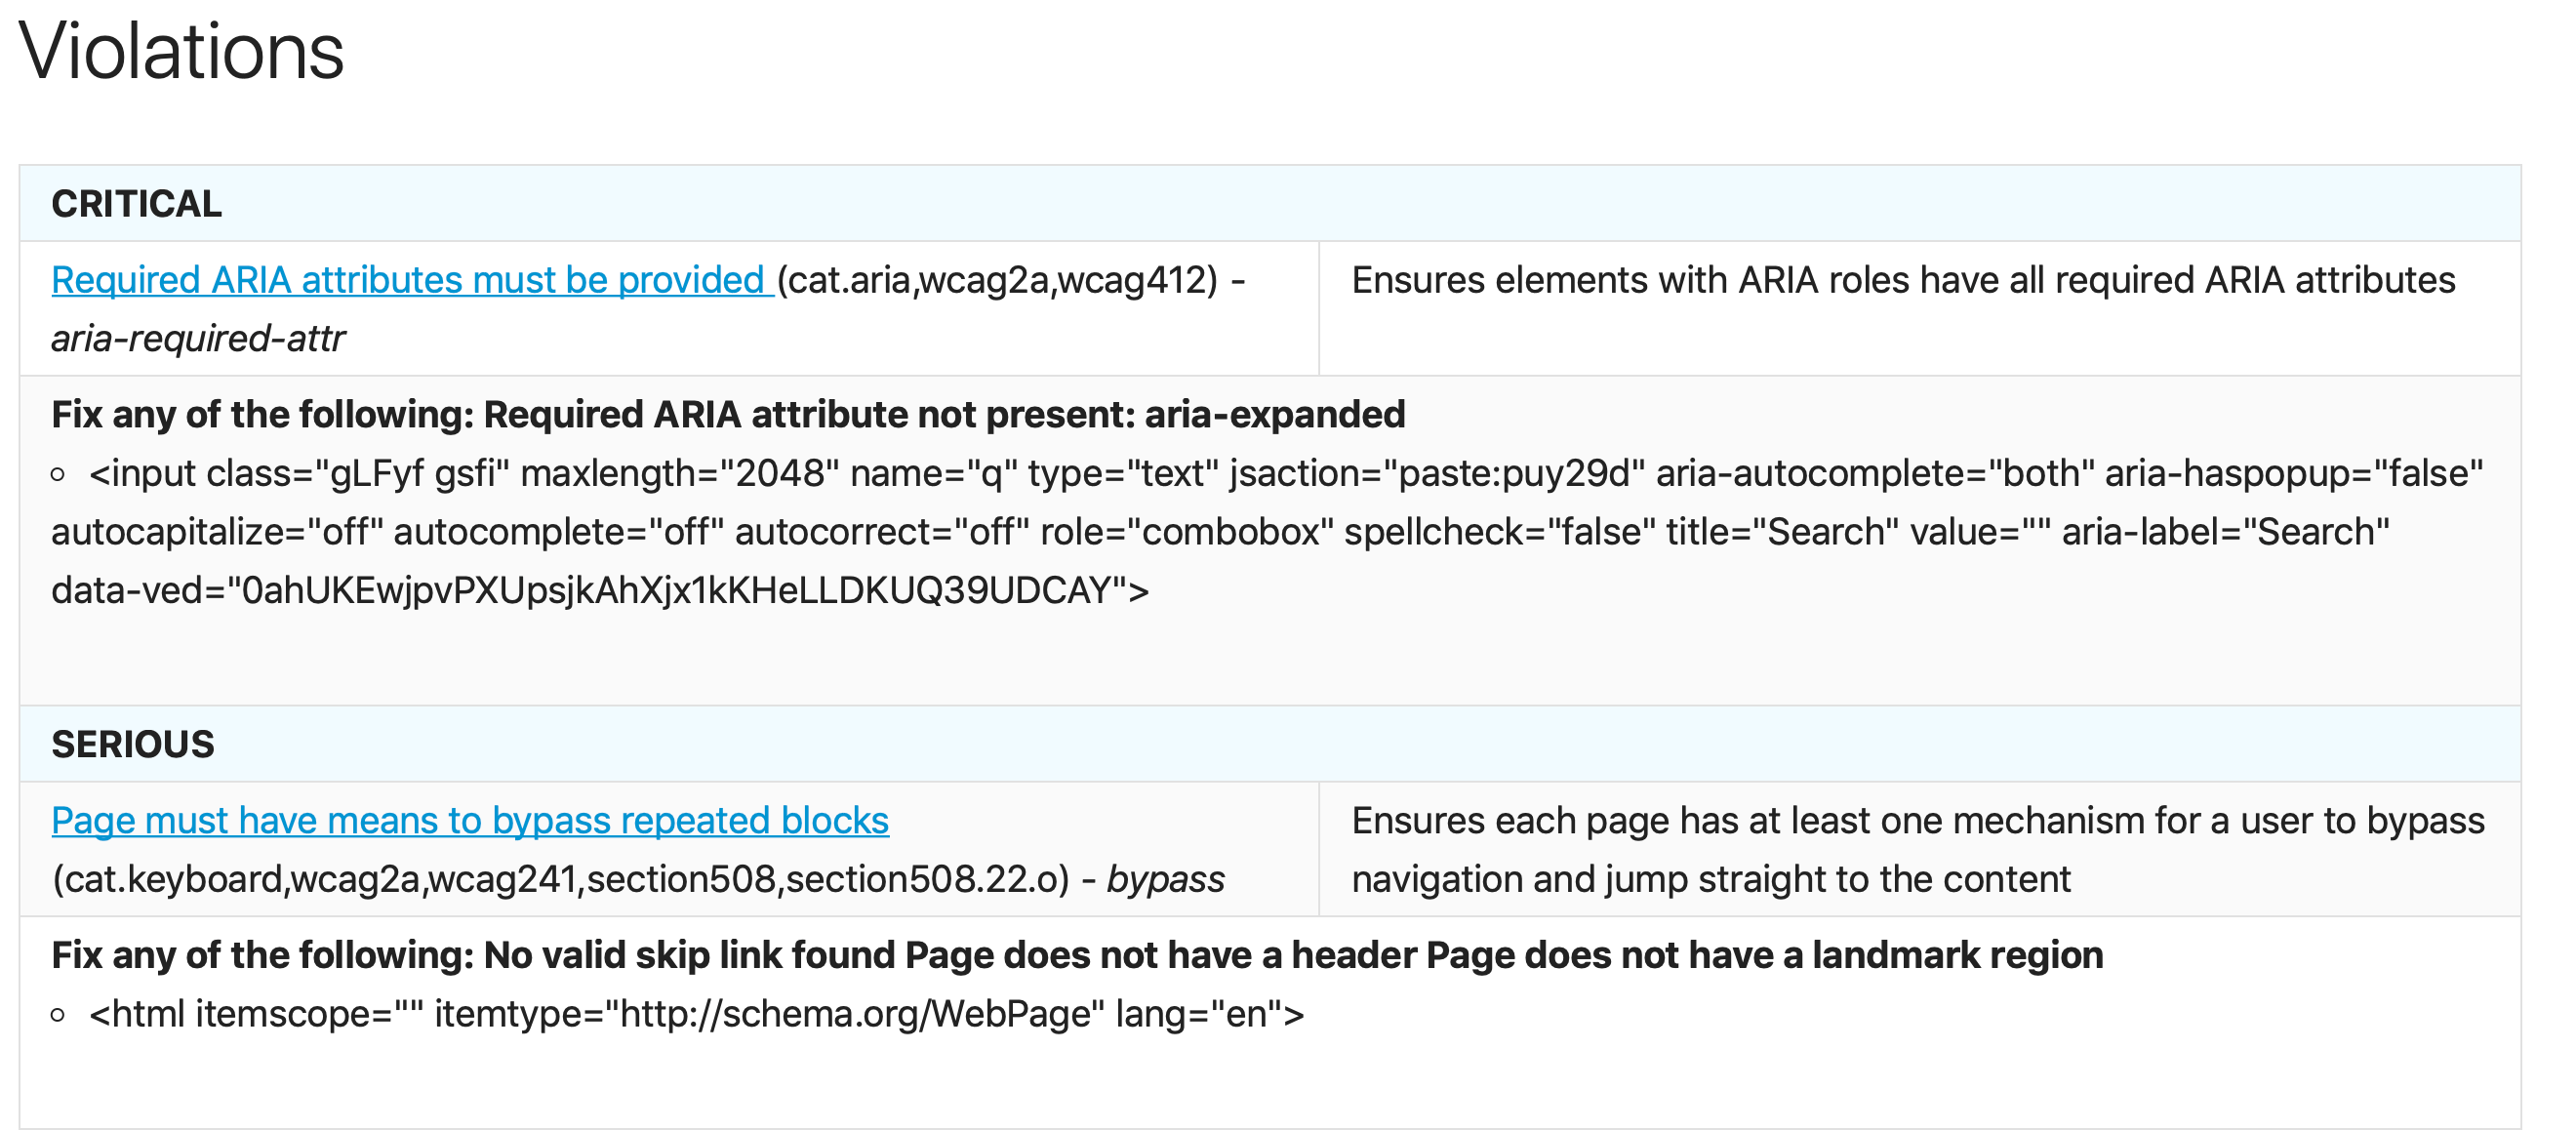
What I personally like about the approach we’ve been using is that by using the raw axe-core you can configure it however you want.
The metrics are also sent to Graphite/InfluxDB so you can create alerts on violations if you want. 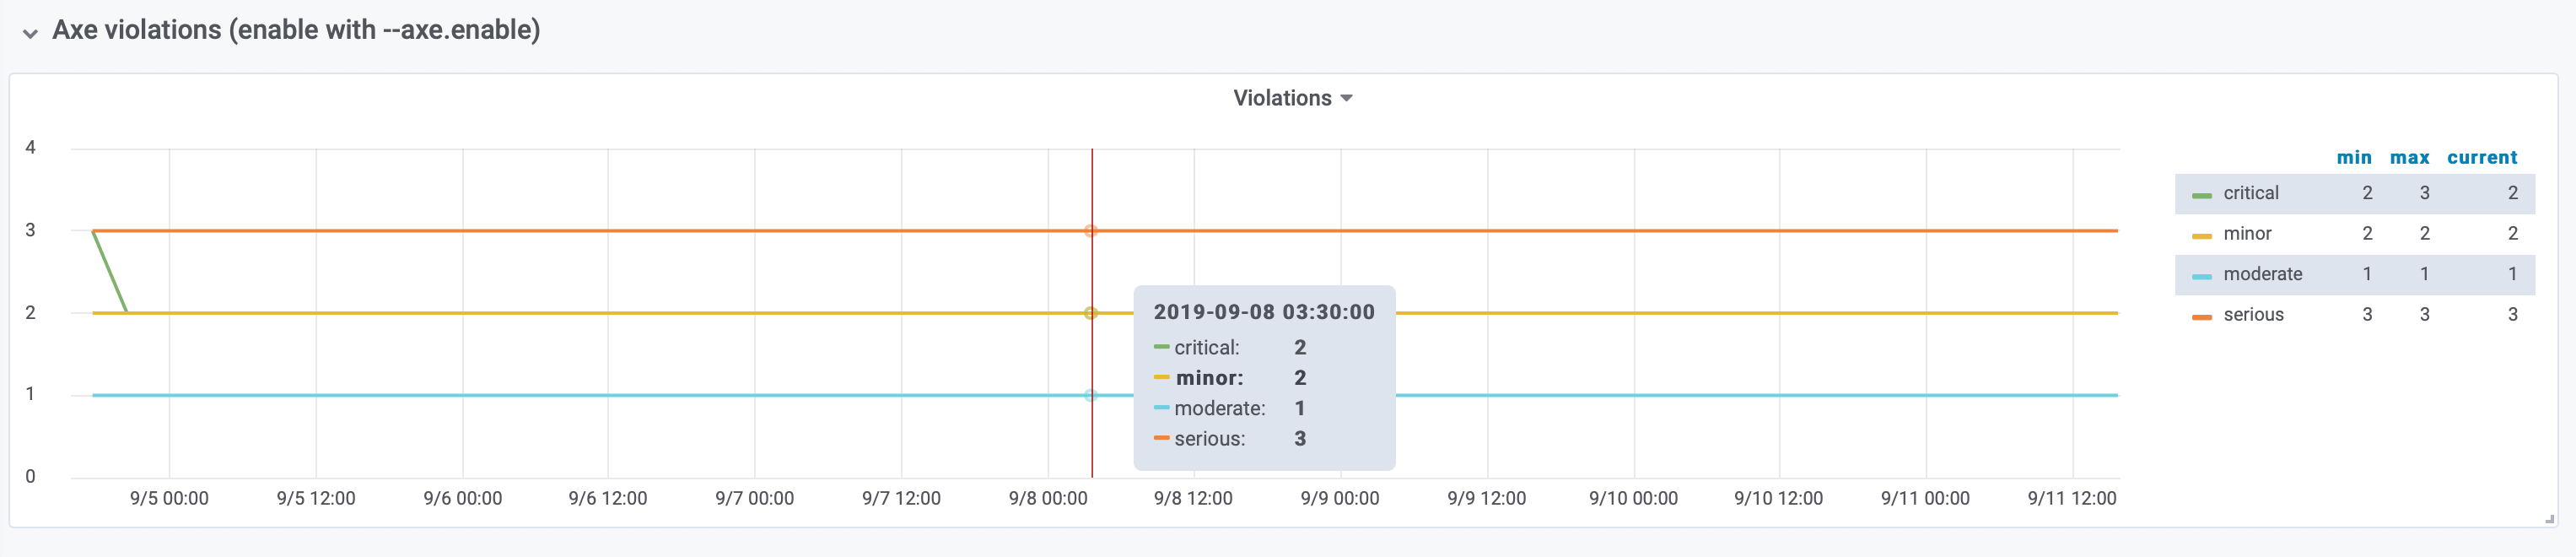
New metrics in Chrome 77 #
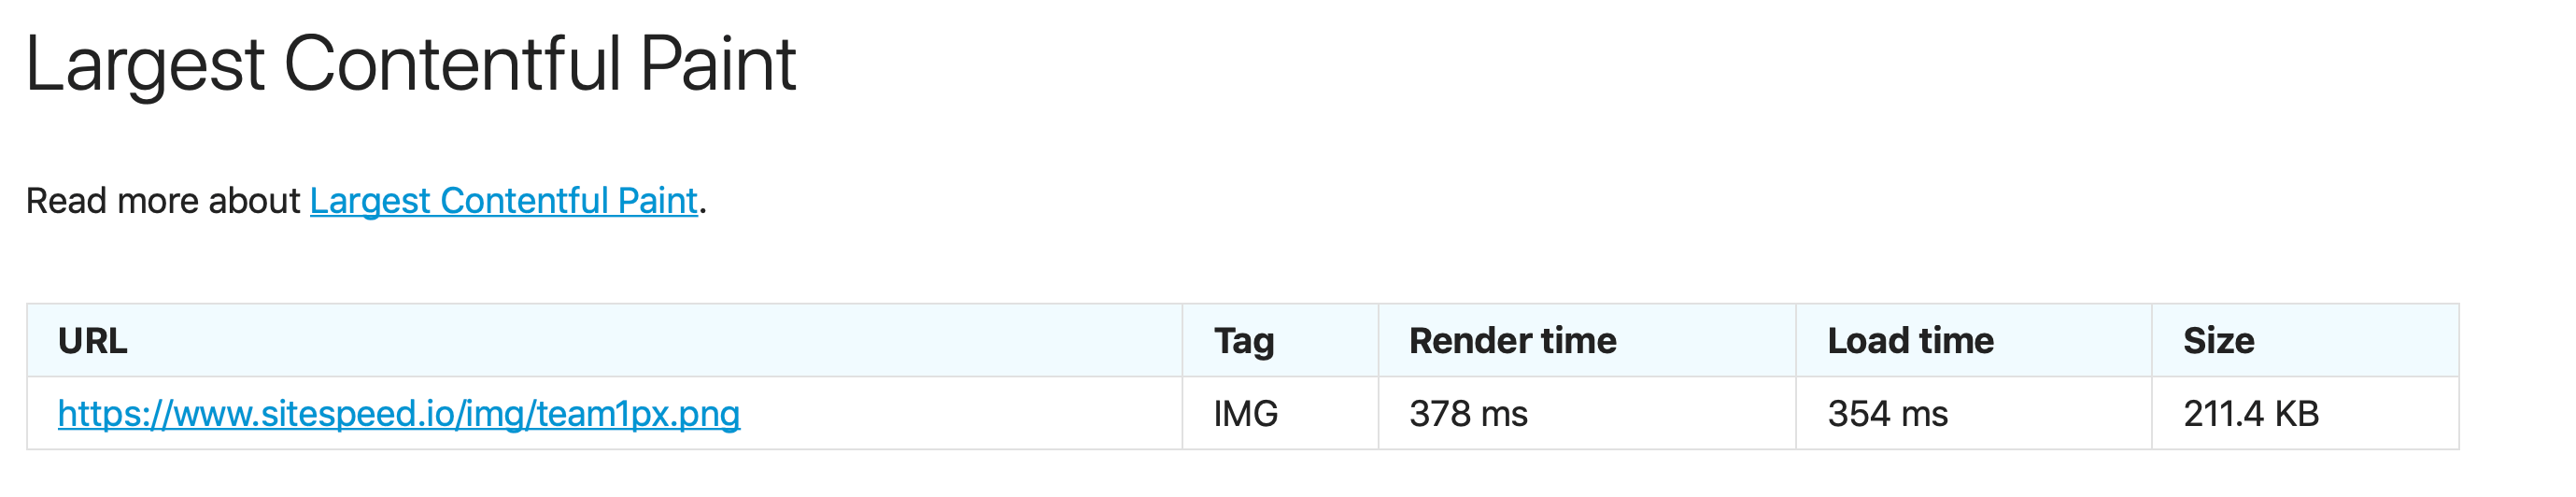
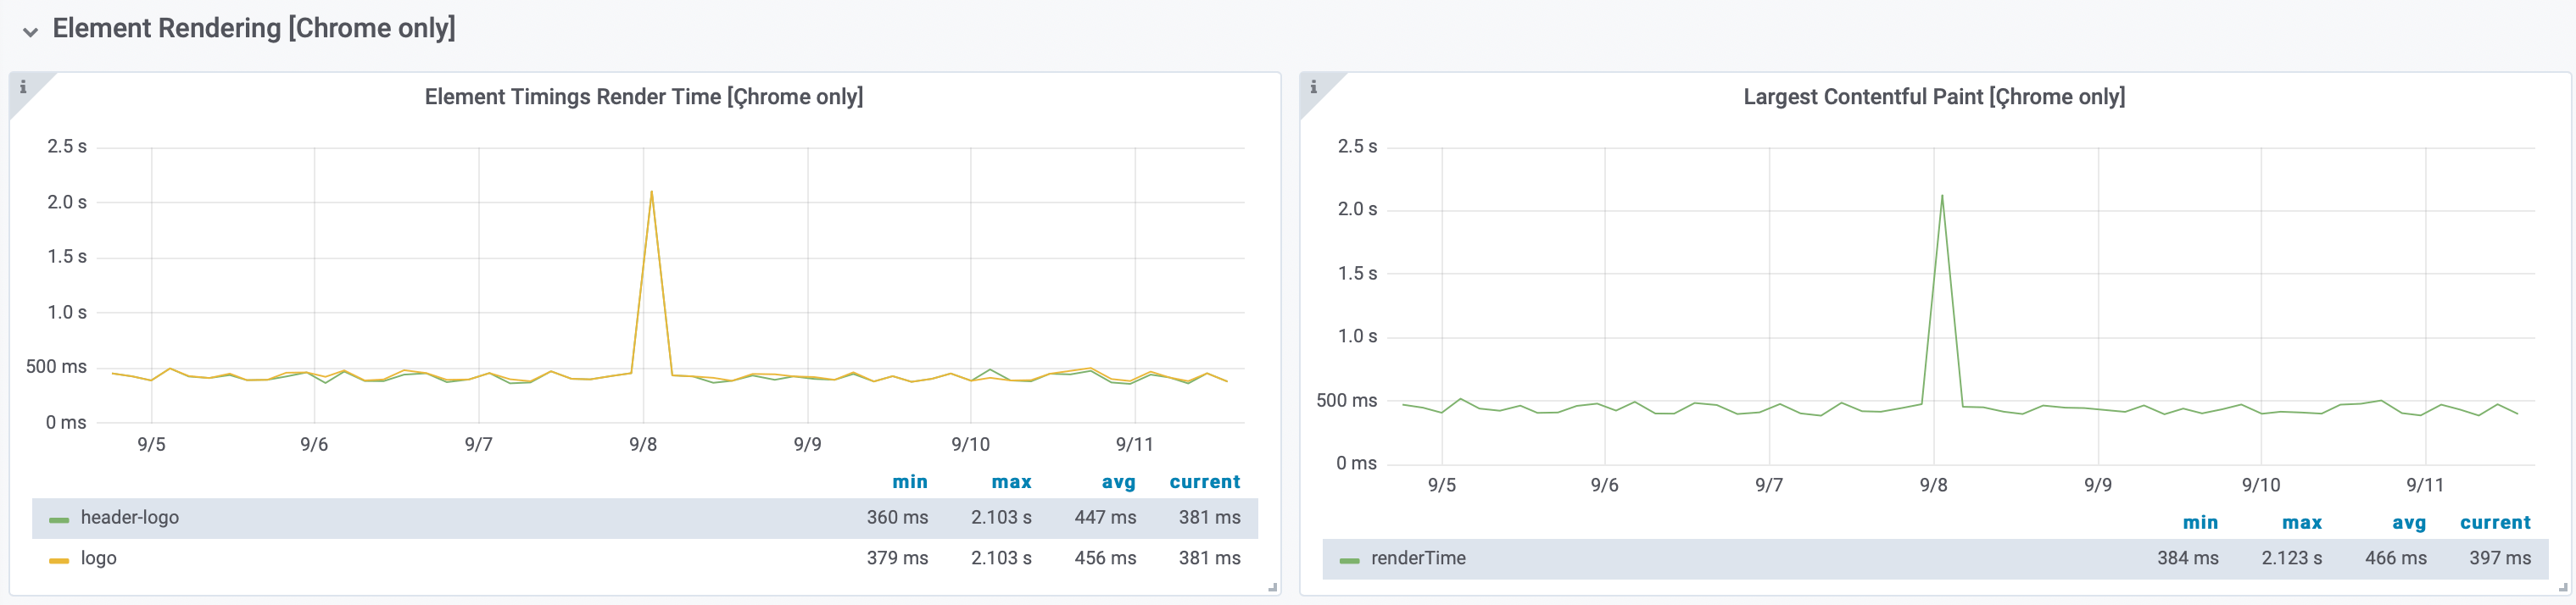
With the release of the latest Chrome you get some new metrics that we automatically collects and sends to Graphite/InfluxDB. The new metrics are Largest Contentful Paint (LCP), element timings for text and images, and Layout instability monitoring.
You can find all the new metrics in the Metrics tab.
Largest Contentful Paint will show timings and meta data about what was actually painted.
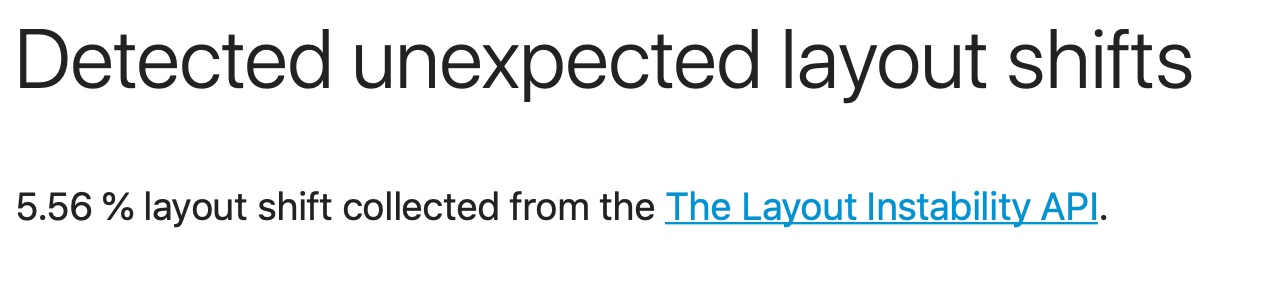
Layout shift will show you in percentage how much the layout shifted. Remember, this is not always bad :)
And then you also get some meta data on Element Timings:
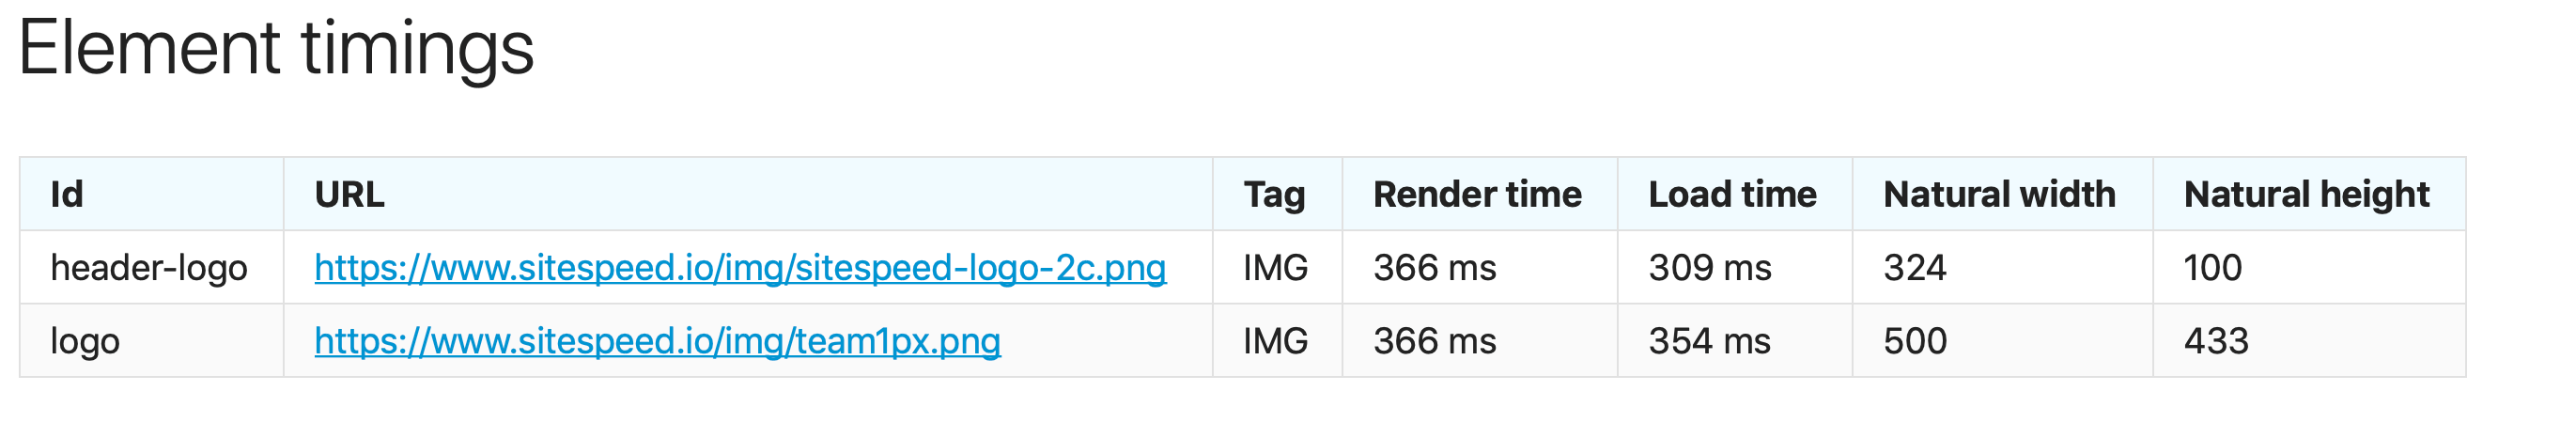
One thing worth mentioning is that to use the Element Timing API you need to mark the elements you want to measure in the HTML. Add the attribute elementtiming and make sure to give it an id as value, something like elementtiming="logo". The id/name that you give your element, is the key that is sent to Graphite/InfluxDB and looks like this:
Test using Safari (OS X/iOS) #
Being able to test in Safari on iOS has been on our priority list forever. With iOS and OS X WebDriver the support has been extended to iOS, so finally there is a way to drive Safari.
We now support (limited) testing with Safari. Testing on OS X works out of the box, but to get iOS to work you will need the coming version of OS X Catalina and iOS 13.
The support is limited at the moment, you will get all the metrics we collect using JavaScript and we do not support HAR, video, or cookies/request headers.
More love for WebPageTest #
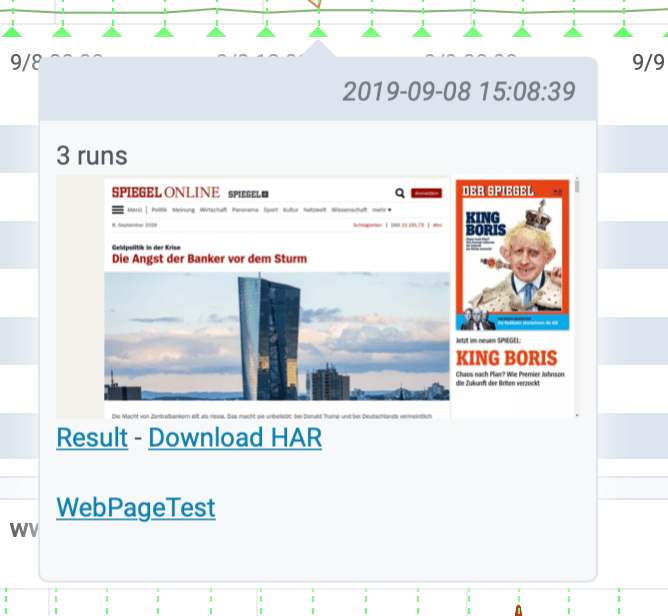
Finally your annotations works for WebPageTest! That means that if you also drive WebPageTest from sitespeed.io, your annotations can get you directly to the WebPageTest result page.
It looks like this:
If you drive WebPageTest and disabled Browsertime, the annotation will show the screenshot from WebPageTest and link to the WebPageTest HAR file.
Dashboards updated #
We have updated all the default dashboards, you download them from here.
Run your tests on Kubernetes #
One of the most asked question the last years has been how do we test using Kubernetes? The problem has been that there is no way to limit the connectivity. You should try out the bandwith plugin that could help you with that.
Breaking changes #
There are also three breaking changes:
- To store the log to file you need to now add
--logToFileto your run. This makes sense that you need to make an active choice to store the log file#2606. - Using
--debugnow set the log level to verbose instead of just logging the message queue. To log the message queue use--debugMessages#2607. - We updated yargs so if you extend your configuration files, they are now deeply merged (at least for the first level of extends).
Other new functionality and fixes #
- Multiple bug fixes for the Slack plugin: Show the correct connectivity, always have a red color when we have an error and fixed bug when comparing metrics (we compare with median) #2610.
- Added new metrics for slacking errors/warnings: firstPaint, visualComplete85, lastVisualChange, fullyLoaded (and fixed broken fullyLoaded) #2611.
- Show the top 20 largest assets on the PageXray tab #2583
- Show the transfer size of assets (not only content size) in the toplists in the HTML #2560
- Unified how to log the options object, so that Browsertime and sitespeed.io follow the same standard. You can now log your options/configuration with
--verbosethat is super helpful when you need to debug configuration issues #2588. - Sending metrics to InfluxDB was broken because of a bug in how we get the connectivity name. Fixed in #2587.
- HTML fix for showing the script in the result HTML #2597.
- Running a script, testing multiple different domains, having aliases made data in Graphite sent under the wrong group/domain. Fixed in #25###92
- Upgraded to Ubuntu Disco in the Docker container #908.
- There’s an alternative to collect Visual Metrics using the Chrome trace log, using SpeedLine implemented in #876. Using video give more accurate metrics (at least in our testing) but maybe it could help running on Chrome on Android and add less overhead than recording a video. You can enable it with:
--cpu --browsertime.chrome.visualMetricsUsingTrace --browsertime.chrome.enableTraceScreenshots
We have some more changes and some bug fixes that you can read about in the changelog.
/Peter