Sitespeed.io 4.6.0
Hi and welcome to the third release in March! One problem in the past has been that if you check your graphs in Grafana (min/median/max values) and then click your way back to the result summary page for that URL, there was no way to know which run that generated the data in Grafana (except going through all individual runs). We have fixed that! The timings summary table metrics links to that individual run:
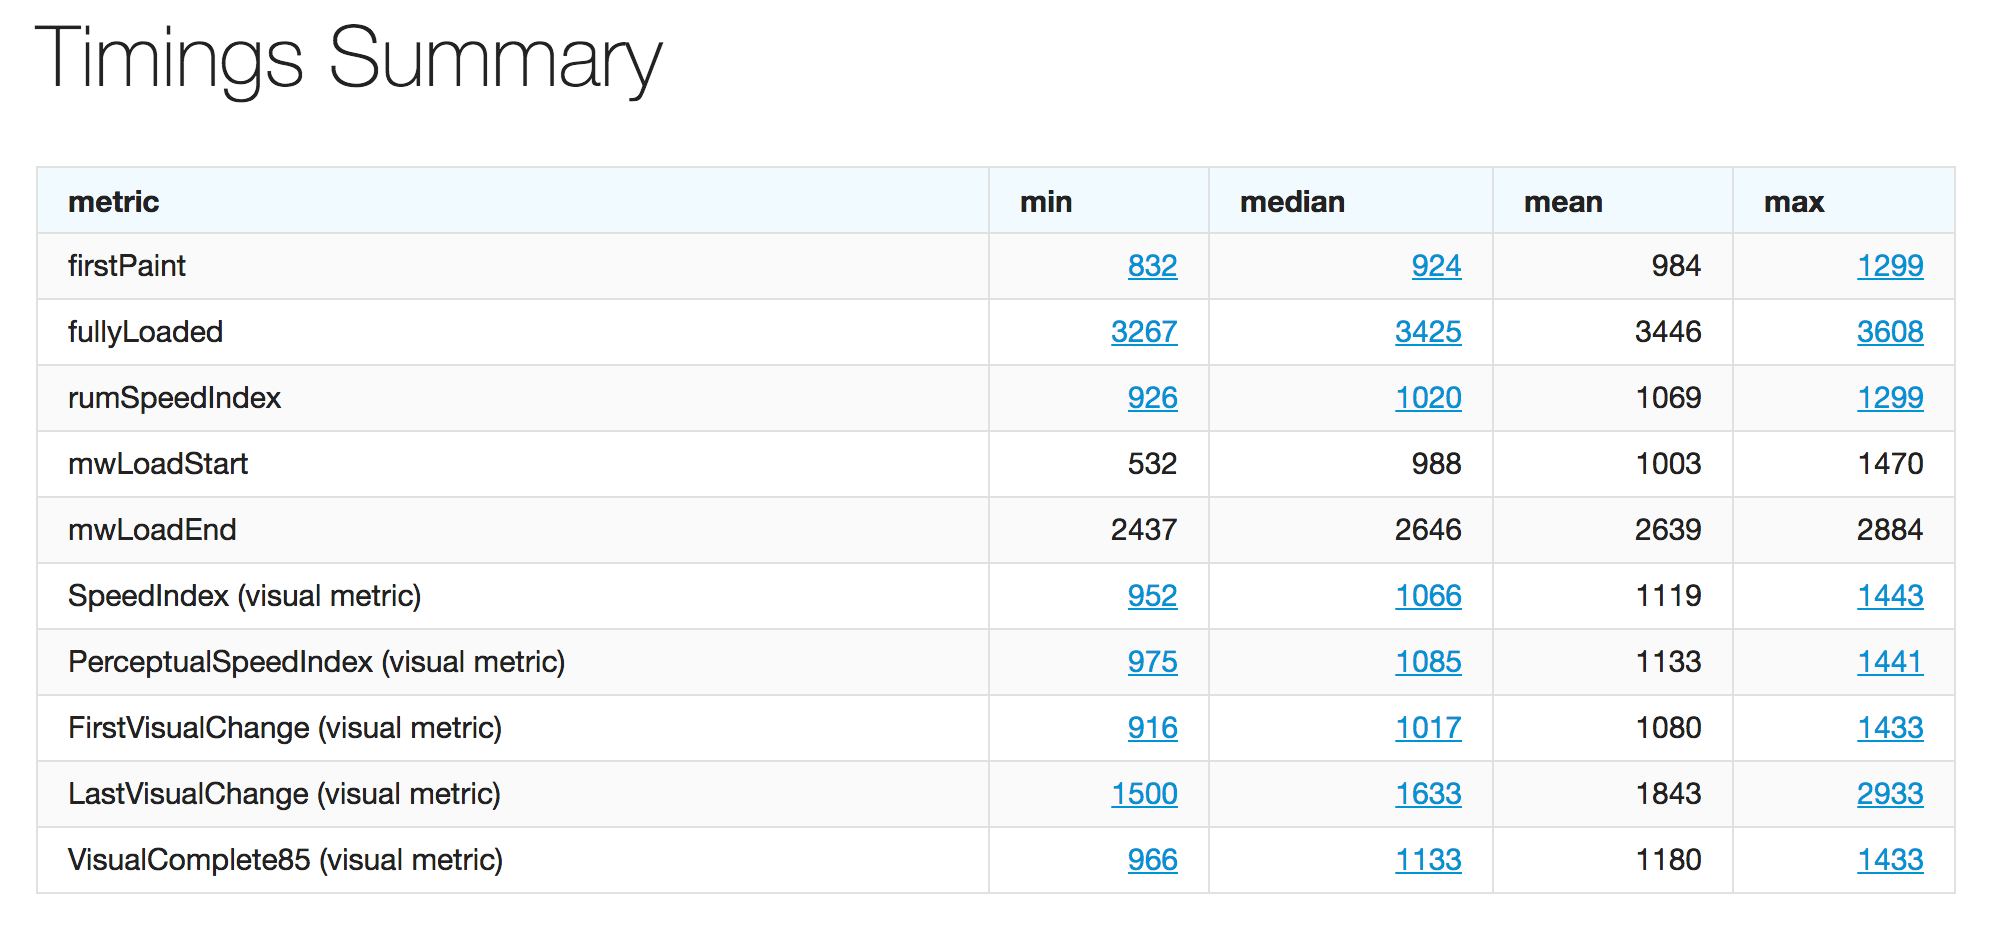
Click on min/median/max for SpeedIndex and you get to that run with the SpeedIndex that has that value #1457.
Polished result pages
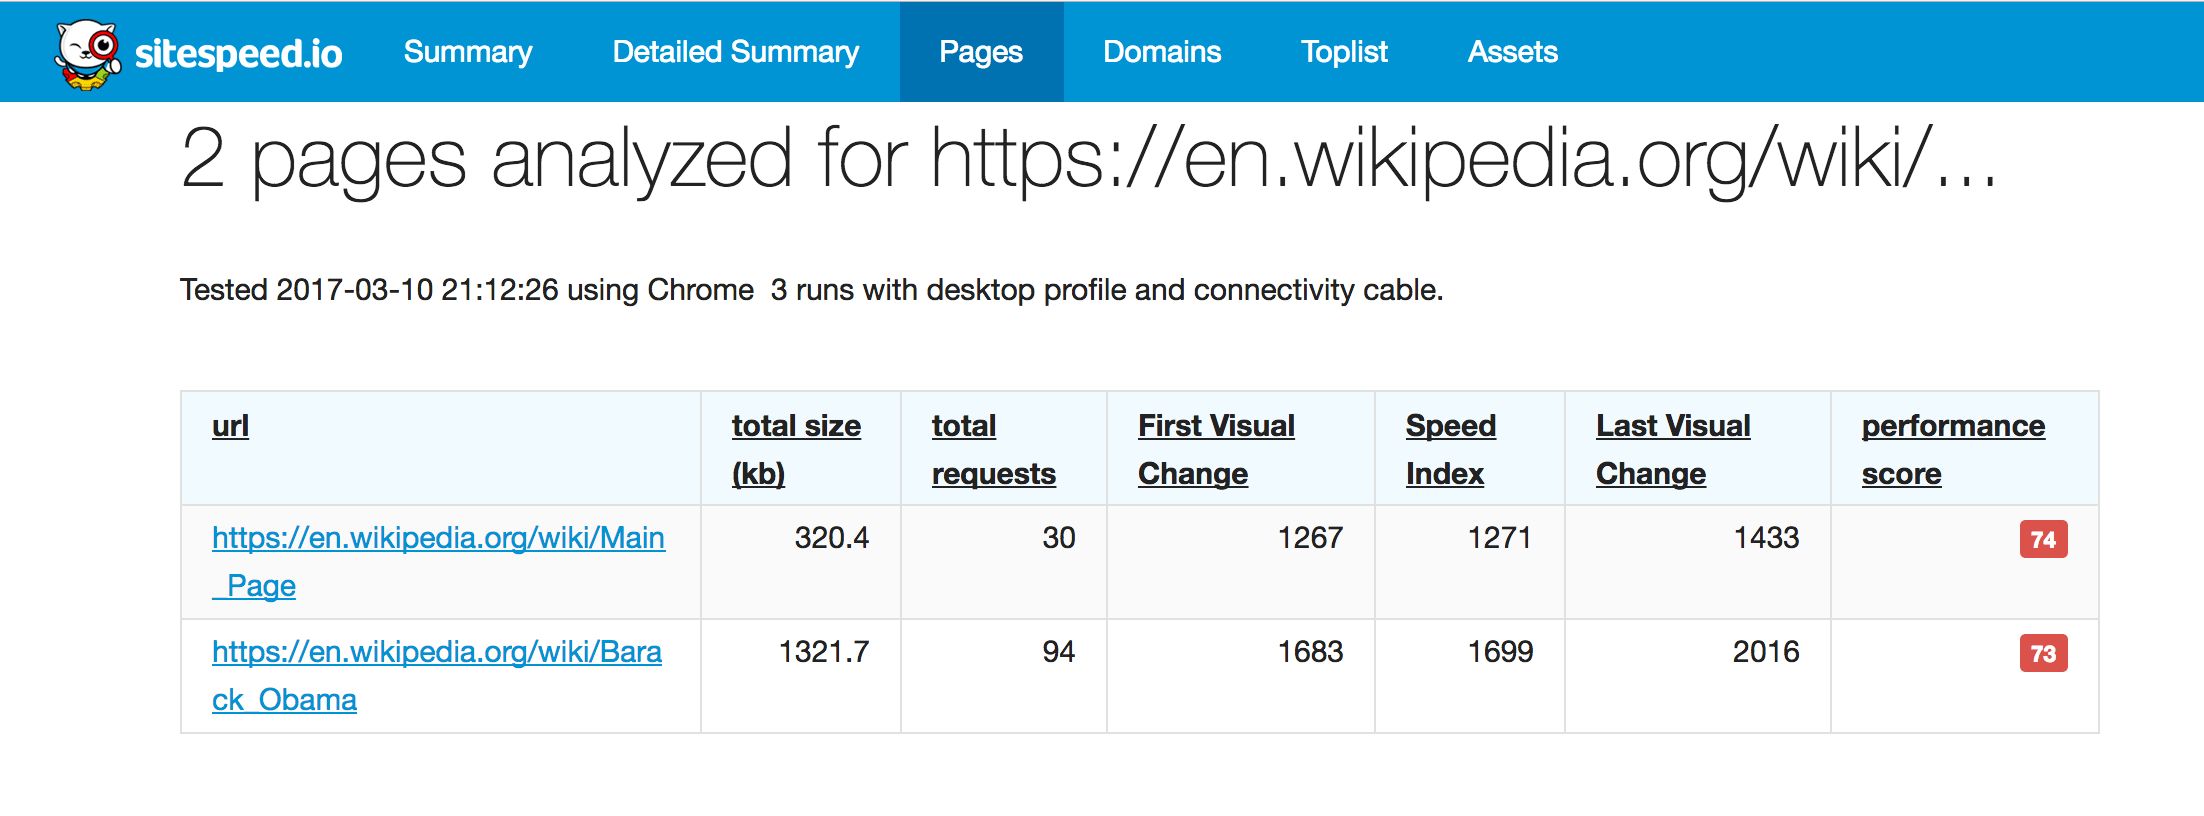
We also polished the result page:
-
Show SpeedIndex, FirstVisualChange and LastVisualChange in columns for pages (so you can sort them) #1489.
-
Upgraded to PerfCascade 0.9.0 that is smarter when drawing time lines if your page take more than 10 seconds to load, see PerfCascade #160.
-
Show preURL and connectivity type for all result pages #1493.
-
You can now choose to load the HAR file using the fetch API instead of inlining it in the HTML file. Use --html.fetchHARFiles #1484. This will decrease the file size of the result.
We joined the pack: Visual Complete 85% (or more)
In the newest version of Browsertime we include VisualComplete 85% (or more), thank you @jeroenvdb for the idea! You can see the metric in the Waterfall graph and it will automatically be sent to Graphite.
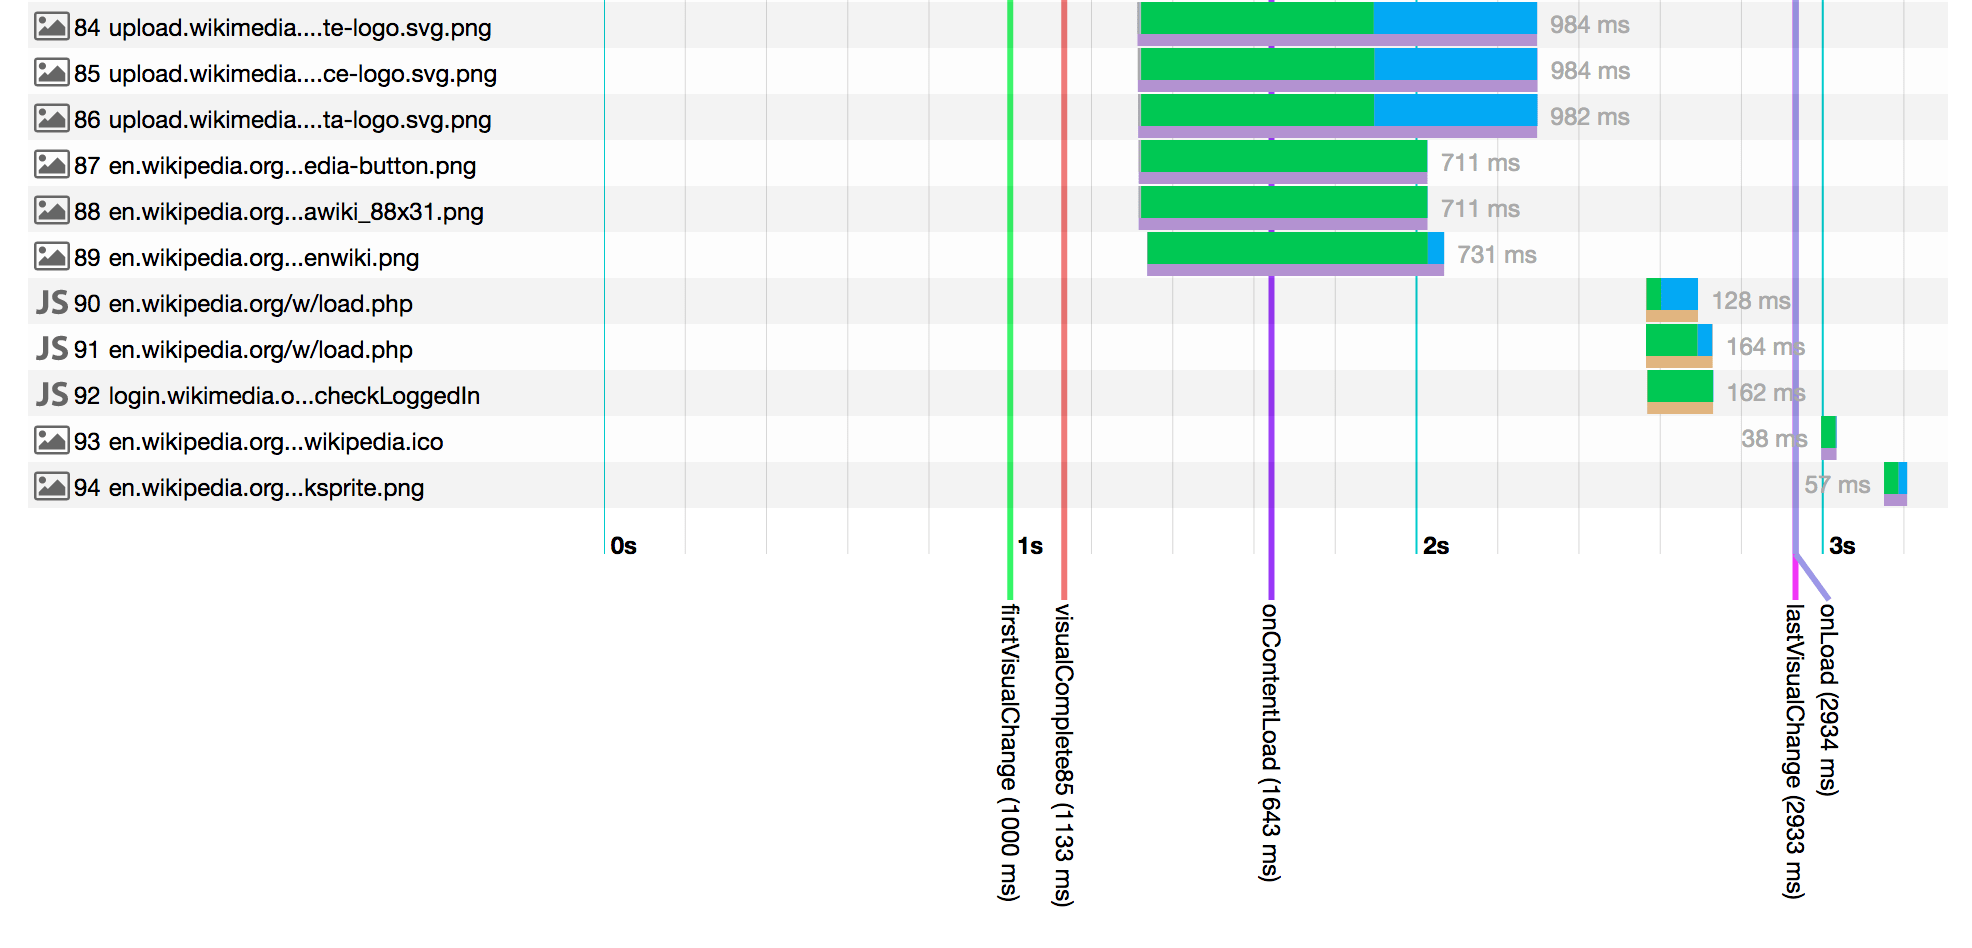
The visual complete 85% is an interesting metrics. Is it as the Lighthouse team says that "The user thinks the page is ready - (They believe the page is done enough to start interacting with)" or is the difference between Visual Complete and Visual Complete 85% a kind of quality metric? We will continue to test and see what you can do with it.
New version of Browsertime
We released a new version of Browsertime (we will soon leave beta) and we released a new tool: Chrome-har that create HAR files from Chrome Debugging Protocol data. We moved out the functionality out of Browsertime so others also can use it. There are also some tweaks and bug fixes. Let us know if there's something else that needs to be fixed.
More metrics to Graphite
We send number of script tags, local storage size and number of cookies by default to Graphite. If you haven't looked at our example graphs the last weeks, you should really have look. We have made it even cleaner and you can easily get the dashboards yourself using Grafana bootstrap.
Chrome 57 and Firefox 52
We updated the Docker container to use the latest and greatest of Chrome & Firefox.
Bug fixes
One new fix for making regions for S3 work #1486.
That was all for this release, see you soon!
/Peter
P.S Read the full changelog for 4.6.0.