Documentation / Third party
Third parties
Categorise third parties
There are two ways to categorise first/third parties. If you use --firstParty, all requests will be categorised as either first or third party and you can see the % of each. This is the old implementation. We also have a newer one where we use the Third party web project to categorise requests so you as a user know what kind of tools the web page is using.
One thing to remember is that a tool can have multiple categories. For example, it can be both an analytics tool AND a surveillance tool.
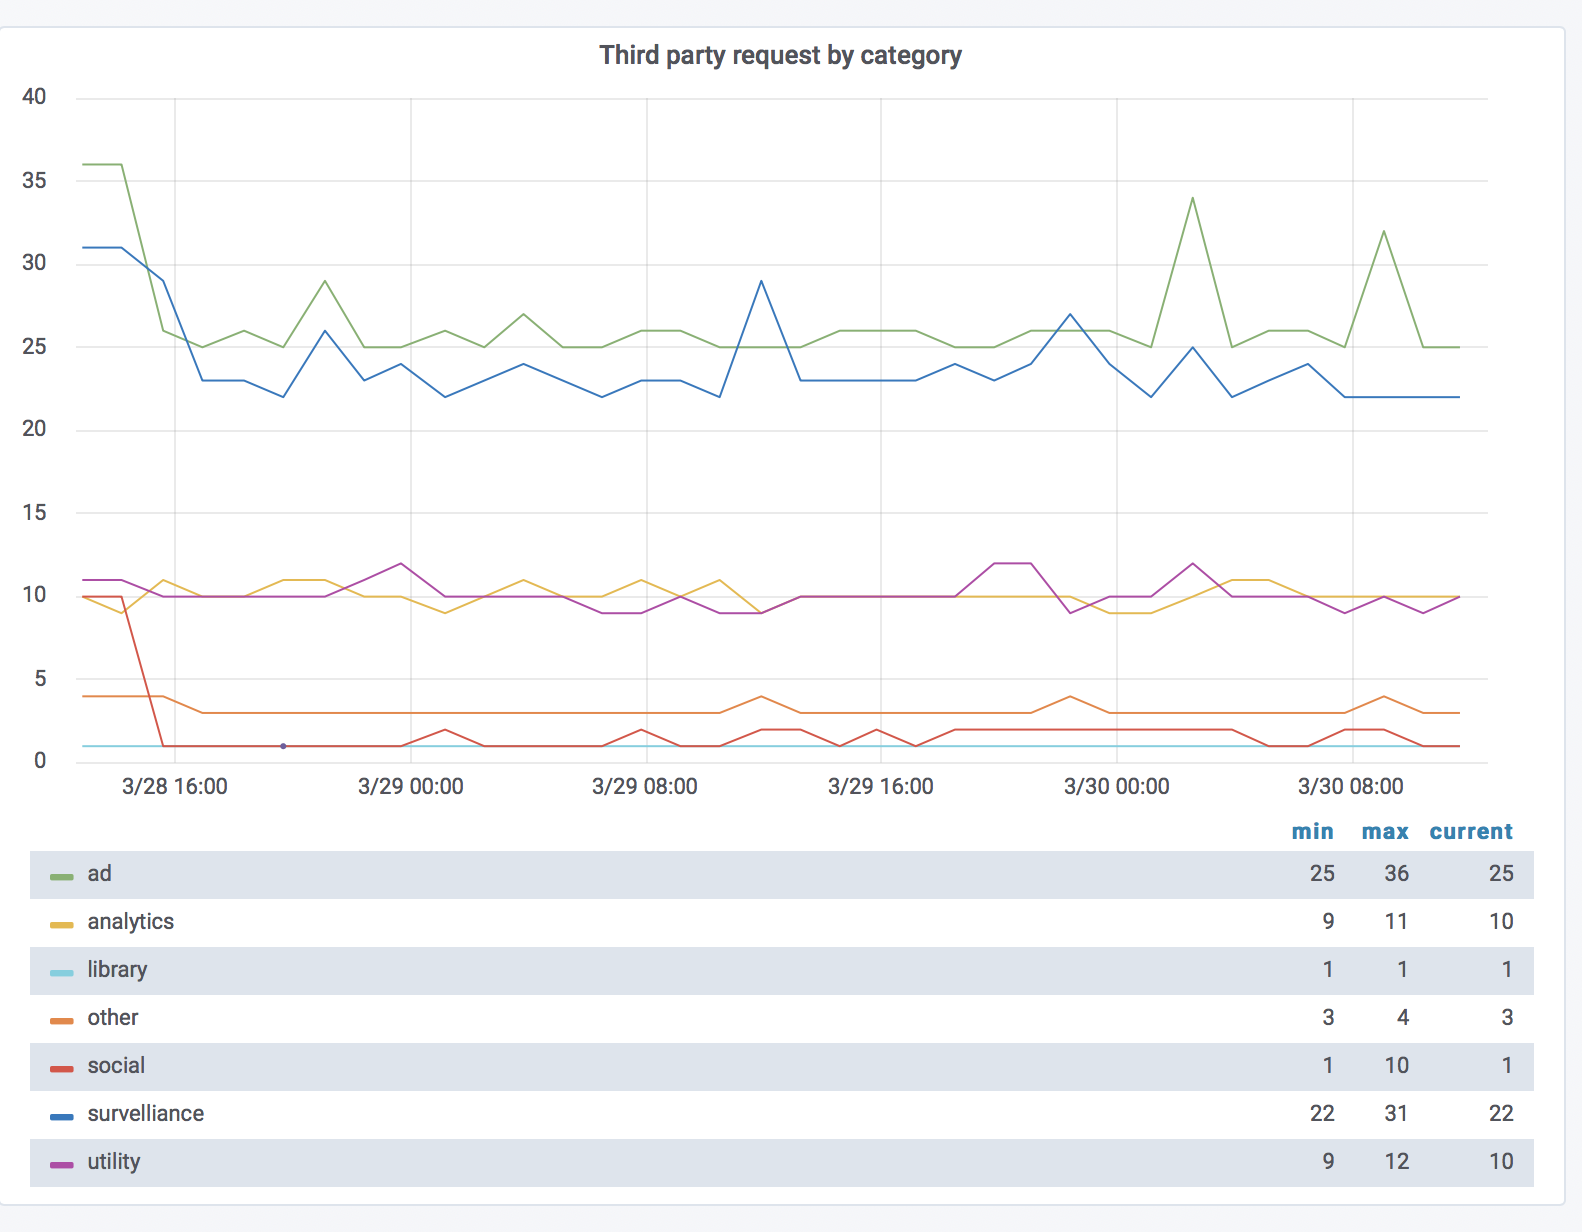
By default the third party information will be sent to Graphite/InfluxDB, and if you are a Graphite user you can upgrade the page summary dashboard to the latest version. You will then get two new graphs.
The first graph shows you third party requests by category. Here you can see how many requests each category generates.
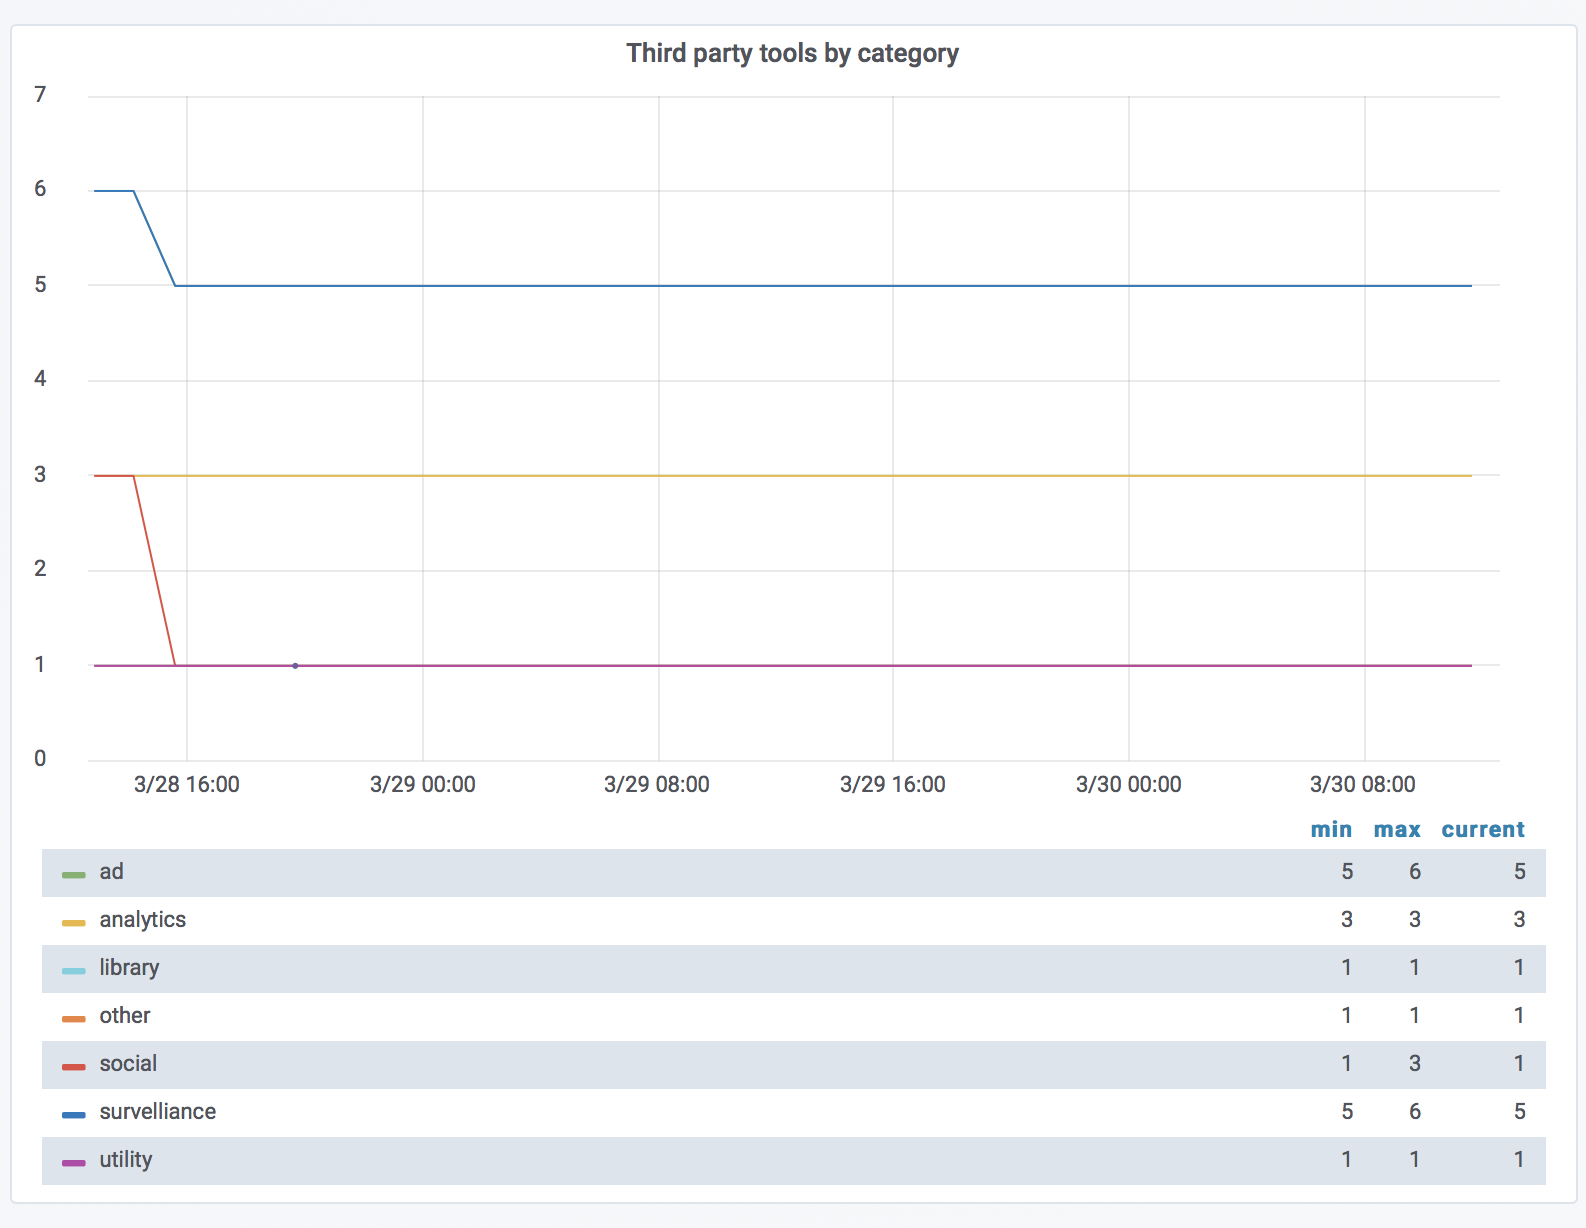
The next graph shows how many tools the page uses by category. This graph will help you see when your content team adds a new analytics tool to the site (but they promised they wouldn't!). What's really cool is that you can add alerts to these metrics too, as you can to all metrics from sitespeed.io.
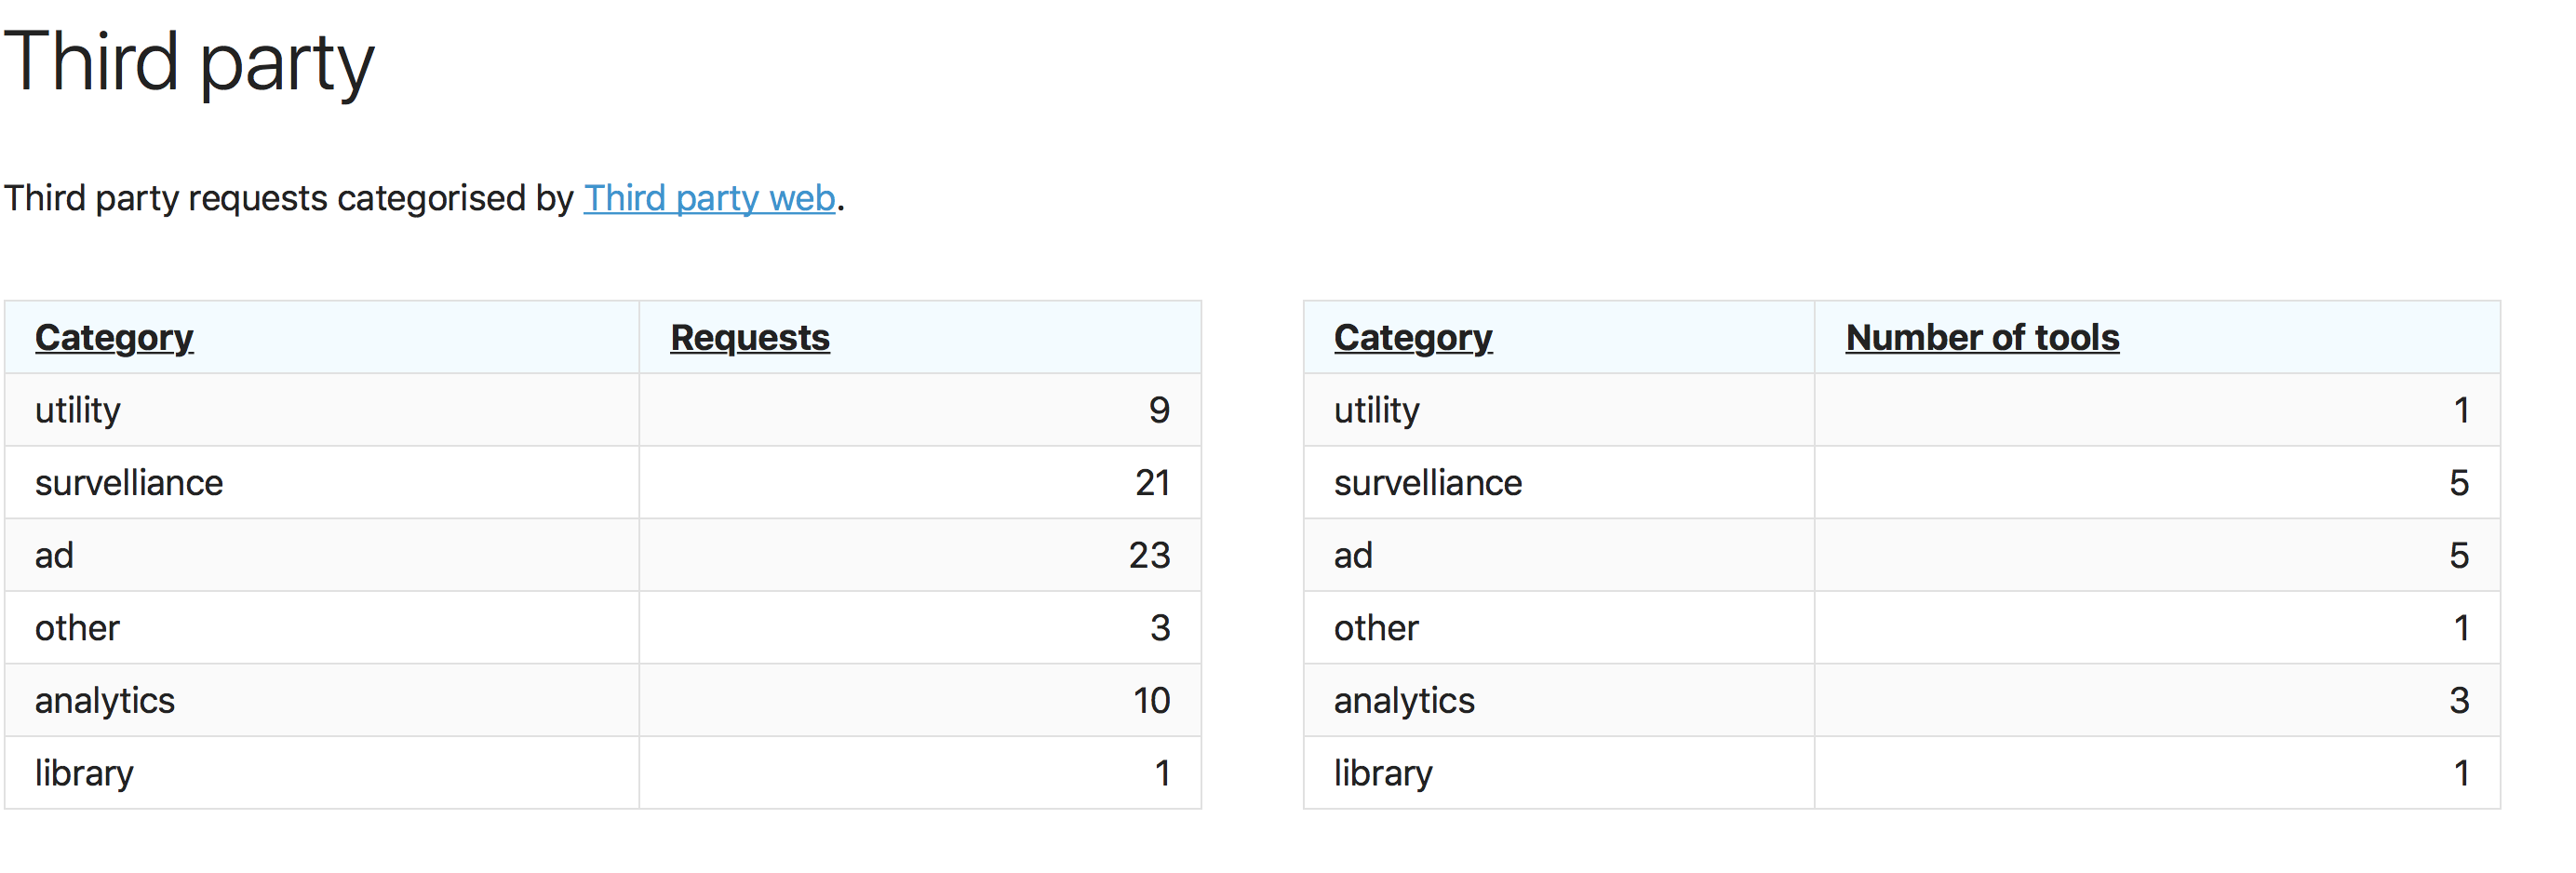
If you look at the HTML result pages, you can also see the same information per URL.
And then also see the exact tools that are used. 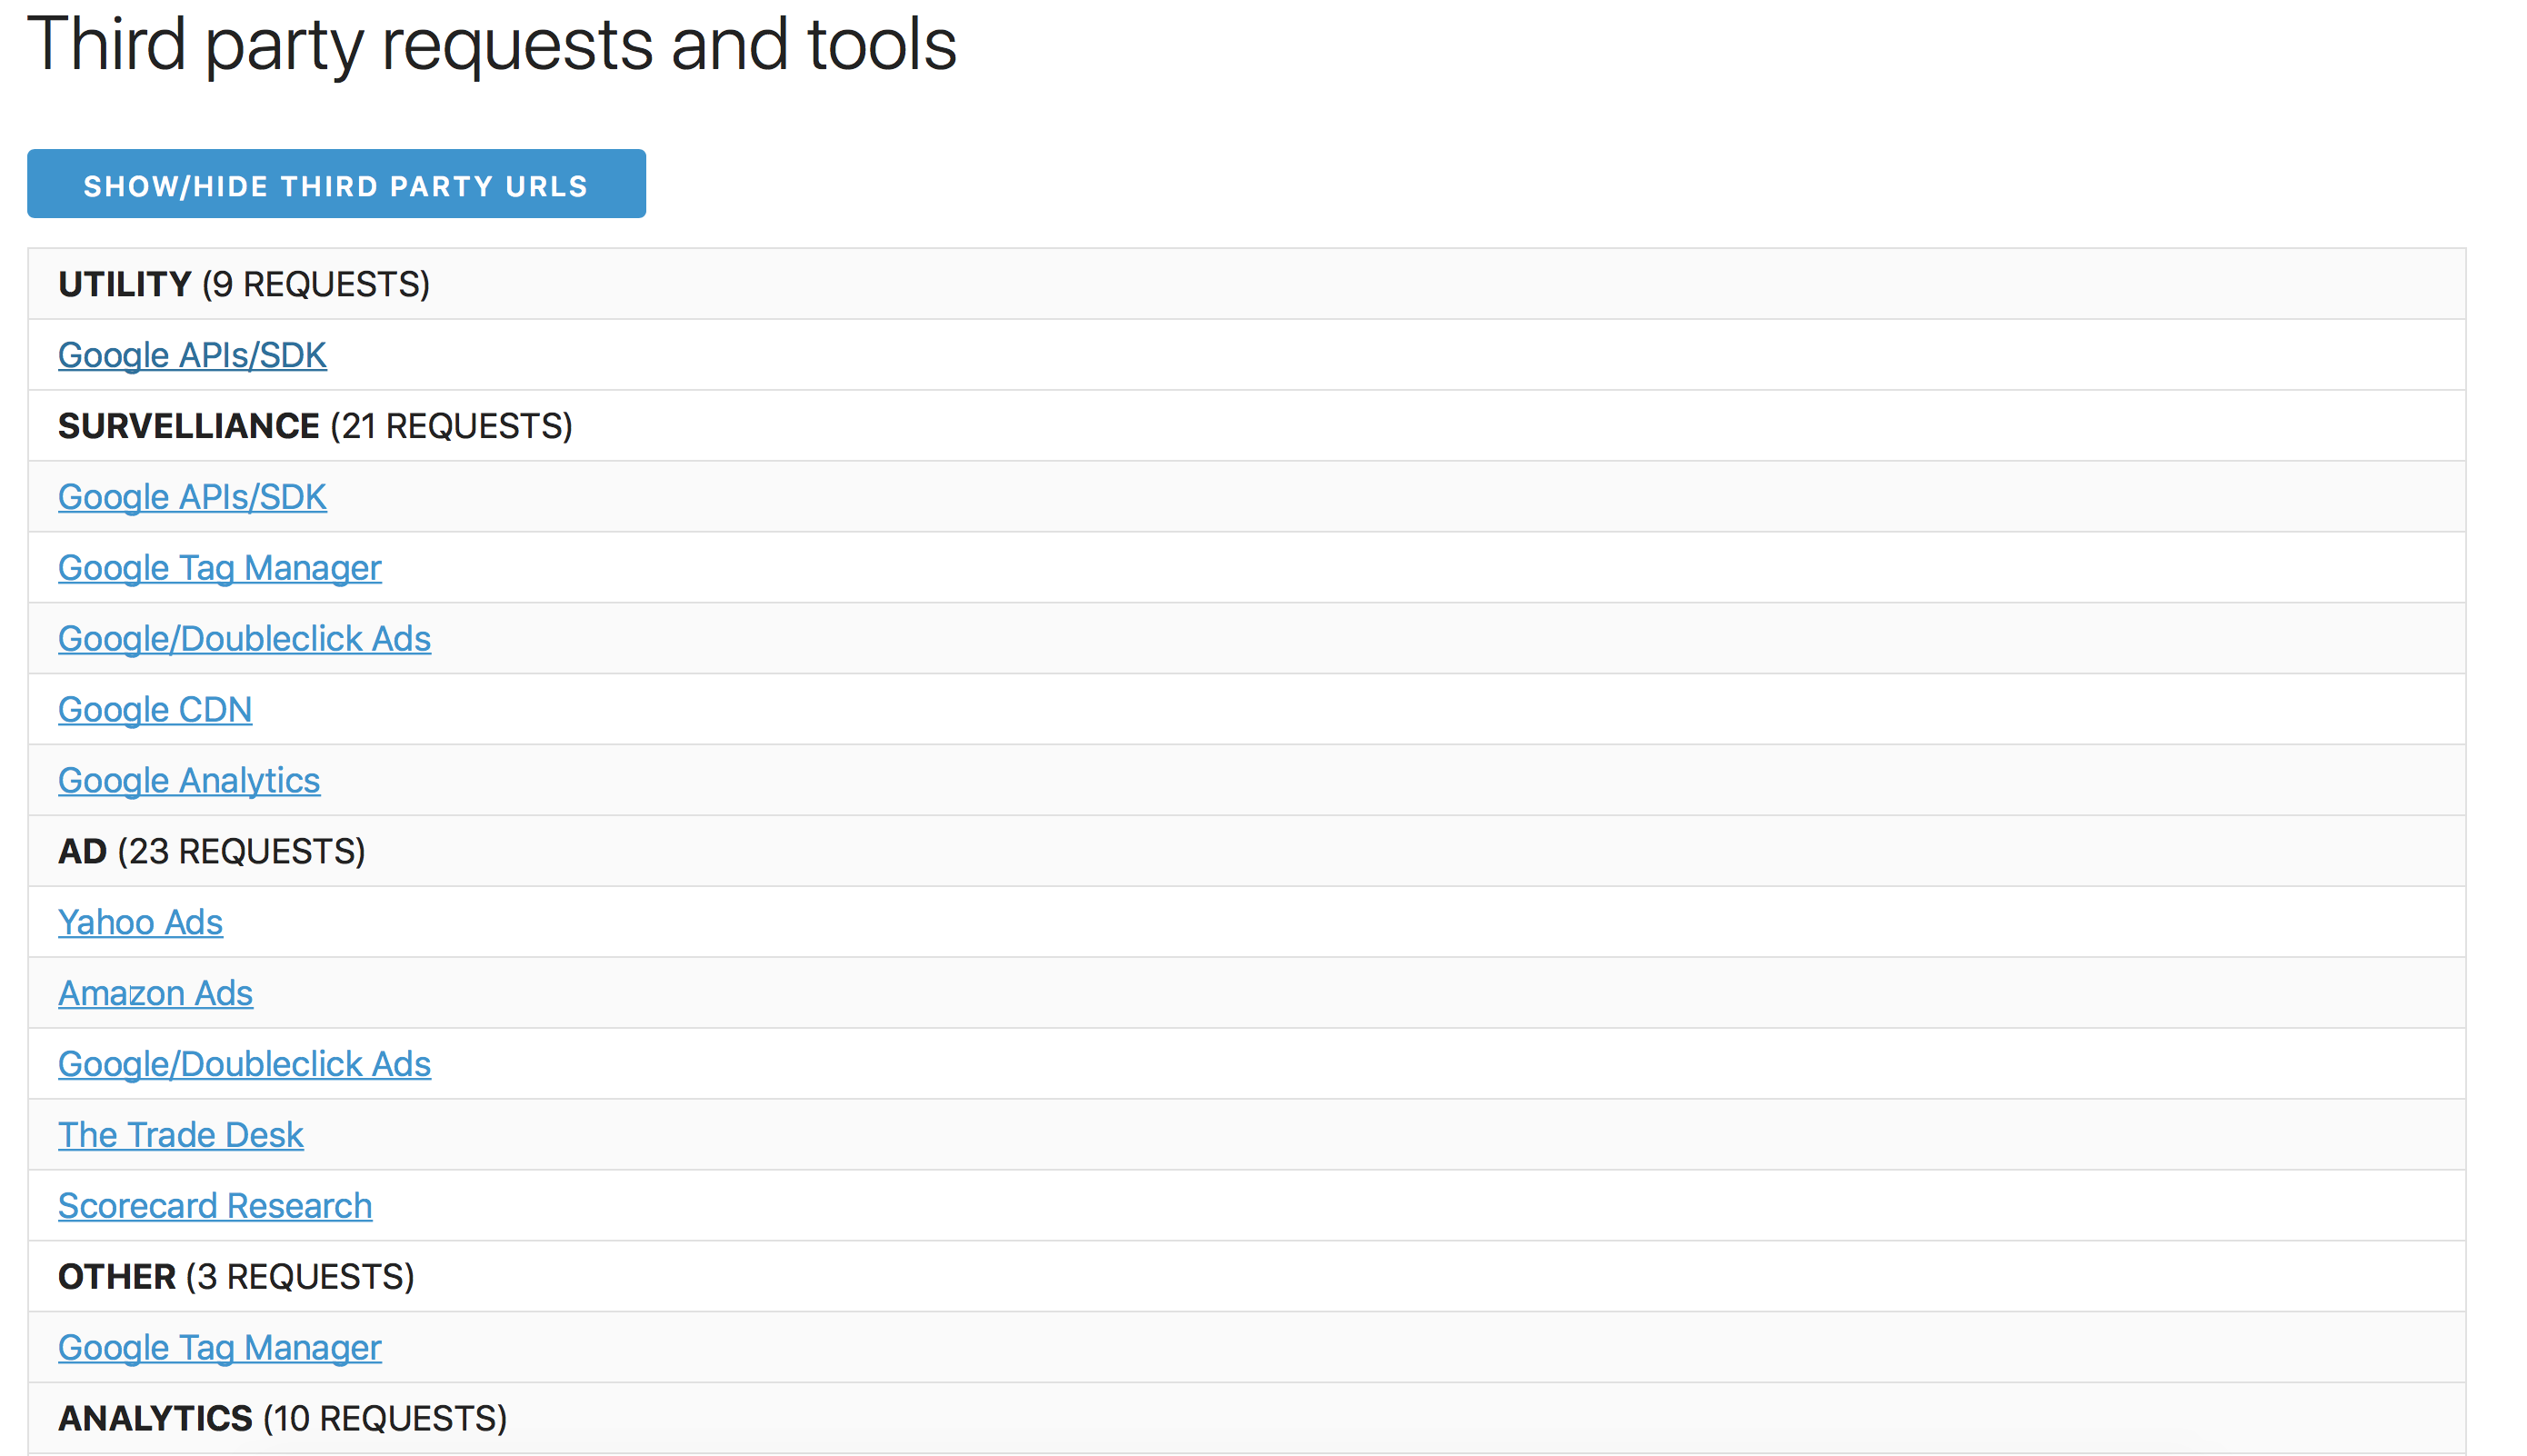
Categories come from coach-core's third-party-web data. If a tool is mis-categorised — or you think the surveillance bucket is too liberal for a particular tool — open a PR against coach-core.
The new categorisation happens automatically.
Requests per page
There's a lot of discussion blaming 3rd parties for performance, and it's now easier for you to track them. However, you need to remember that third parties are also used to share your users' private data with other companies. Remember that privacy is important for your users. That's why we made it easy to see how many third party requests each page does:
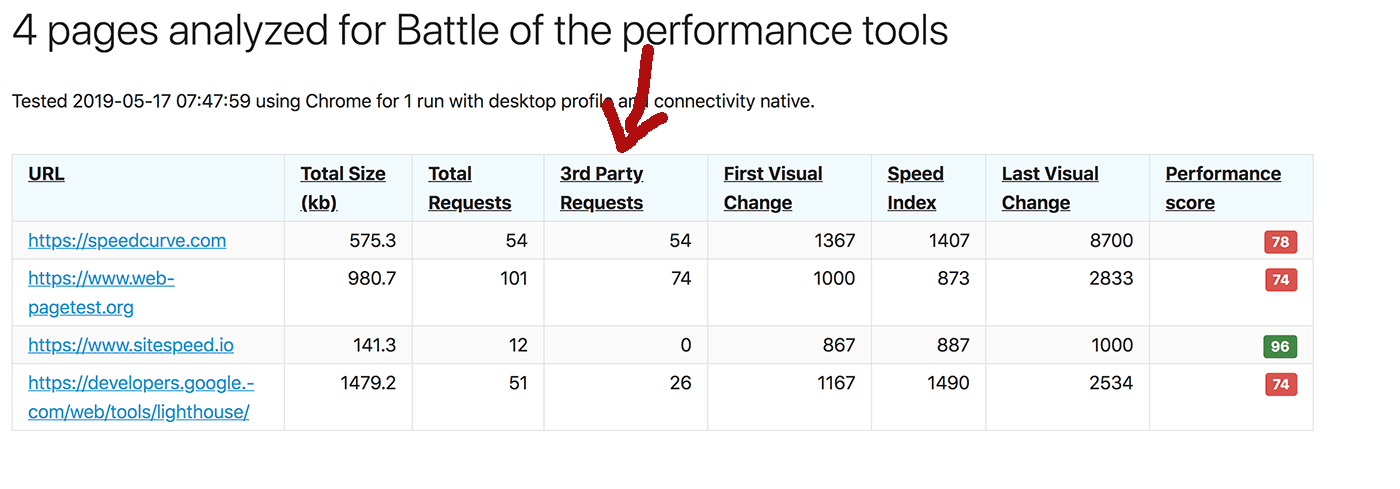
It's easy to see the amount of third party requests.
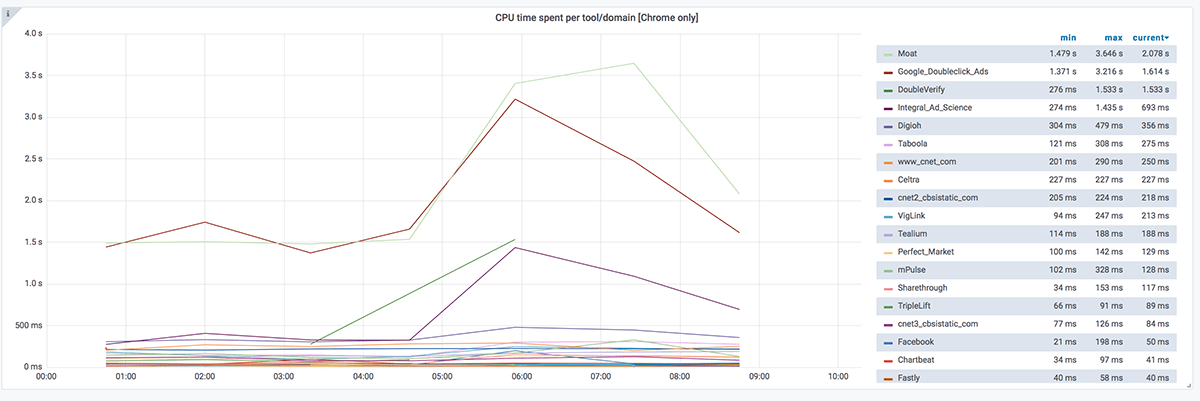
CPU spent per tool/third party
You can also track CPU spent per tool/third party. It's turned off by default; enable it with --thirdParty.cpu when you use Chrome. Then you can have a graph like this:
Block all 3rd parties
We have two ways to block requests when you use sitespeed.io. You can either use --block to block a specific request, request patterns (works in Chrome/Edge) or a domain (works in Chrome/Edge/Firefox), or you can use --chrome.blockDomainsExcept (Chrome/Edge) to block all domains except the ones you choose (you can use wildcards like *.sitespeed.io). You can use both multiple times to keep multiple domains or to block multiple requests.
With the block parameter you block specific requests. Here's an example from Wikipedia that blocks the first JavaScript request:
docker run --rm -v "$(pwd):/sitespeed.io" sitespeedio/sitespeed.io:41.3.3 --block "https://en.wikipedia.org/w/load.php?lang=en&modules=startup&only=scripts&raw=1&skin=vector" https://en.wikipedia.org/wiki/Barack_ObamaBlock all requests that end with .js:
docker run --rm -v "$(pwd):/sitespeed.io" sitespeedio/sitespeed.io:41.3.3 https://www.sitespeed.io -n 1 -o --browsertime.block "*.js"Here's an example from a user that uses WebPageReplay and wants to block all domains except one:
docker run --cap-add=NET_ADMIN --rm -v "$(pwd):/sitespeed.io" -e REPLAY=true -e LATENCY=100 sitespeedio/sitespeed.io:41.3.3 --firstParty ".*(move.com|realtor.com|moveaws.com|rdcpix.com).*" --browsertime.chrome.blockDomainsExcept "*.realtor.com" https://www.realtor.com/