Documentation / CPU
CPU
CPU metrics [Chrome only]
Chrome has a lot of features you can use to get more information about where CPU time is spent. At the moment Firefox lacks support for this but we will add it ASAP when Mozilla implements the features.
Chrome event trace log
We use Tracium to get more useful information out of Chrome. The library has been broken out of Lighthouse by Andrey Lushnikov of the Chrome DevTools team. Much love :)
You can enable it with --chrome.timeline or --cpu. You will then get a trace log stored on your disk. Unpack the file and you can drag/drop it into the performance panel in Chrome.
You will also get a summary in the HTML result file that shows you time spent in:
- parseHTML
- styleLayout
- paintCompositeRender
- scriptParseCompile
- scriptEvaluation
- garbageCollection
This gives you more insight into CPU time spent. And all the metrics are also sent to Graphite/InfluxDB.
Long Tasks
Collect CPU long tasks in Chrome using --chrome.collectLongTasks (or just use --cpu), which uses the Long Task API. A long task is a CPU task that takes longer than 50 ms (but you can configure the length, more about that later).
For the long tasks to work, we inject JS using the Page.addScriptToEvaluateOnNewDocument DevTools command. We collect all long tasks and related data (not so much at the moment but will get better/more useful information when browsers support it).
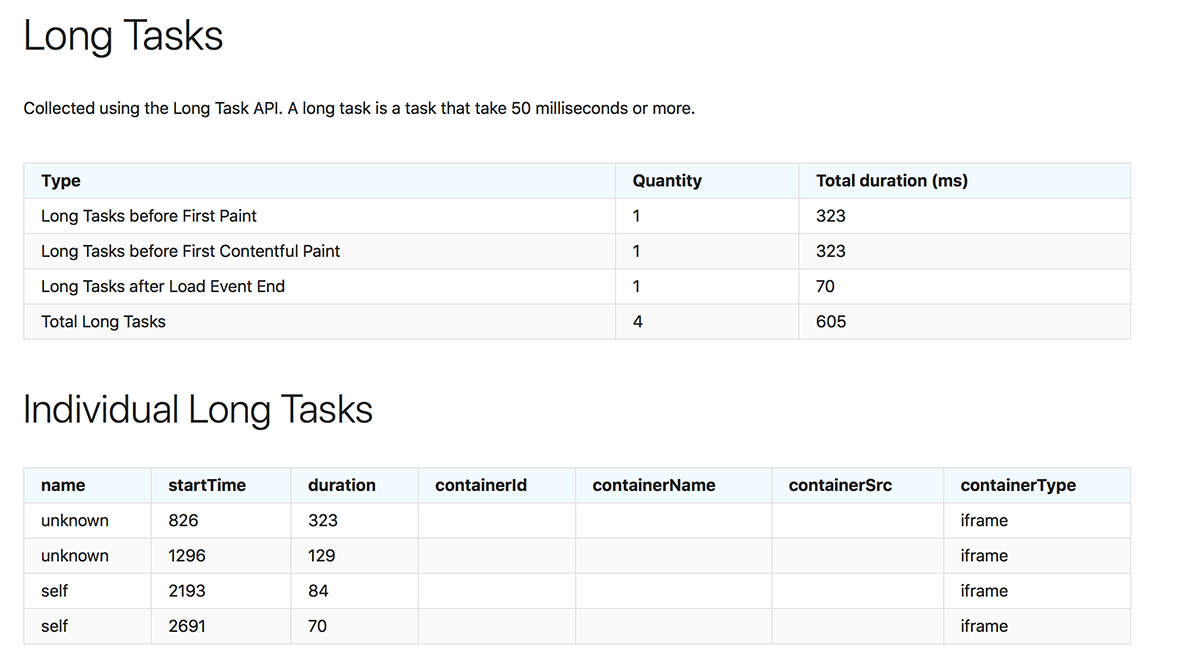
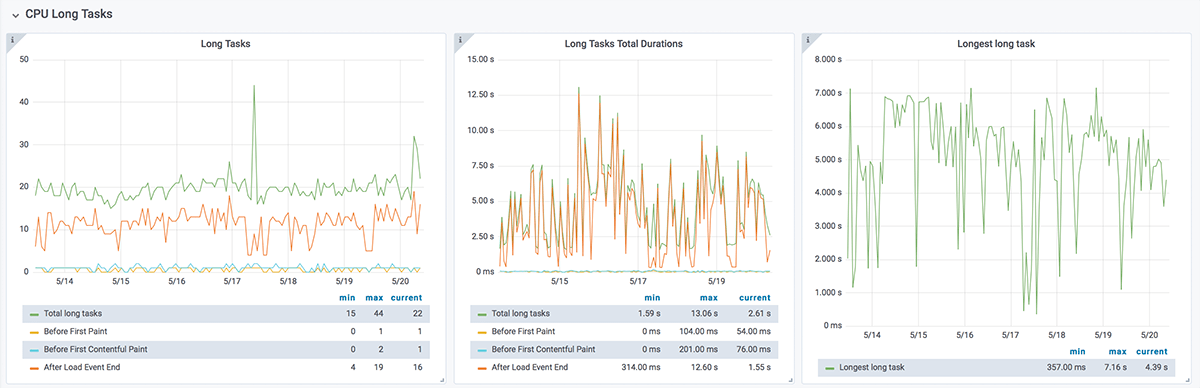
We count the total number of long tasks, the long tasks that happen before first paint and first contentful paint, and the amount that happens after load event end. In Grafana the graphs will look like this:
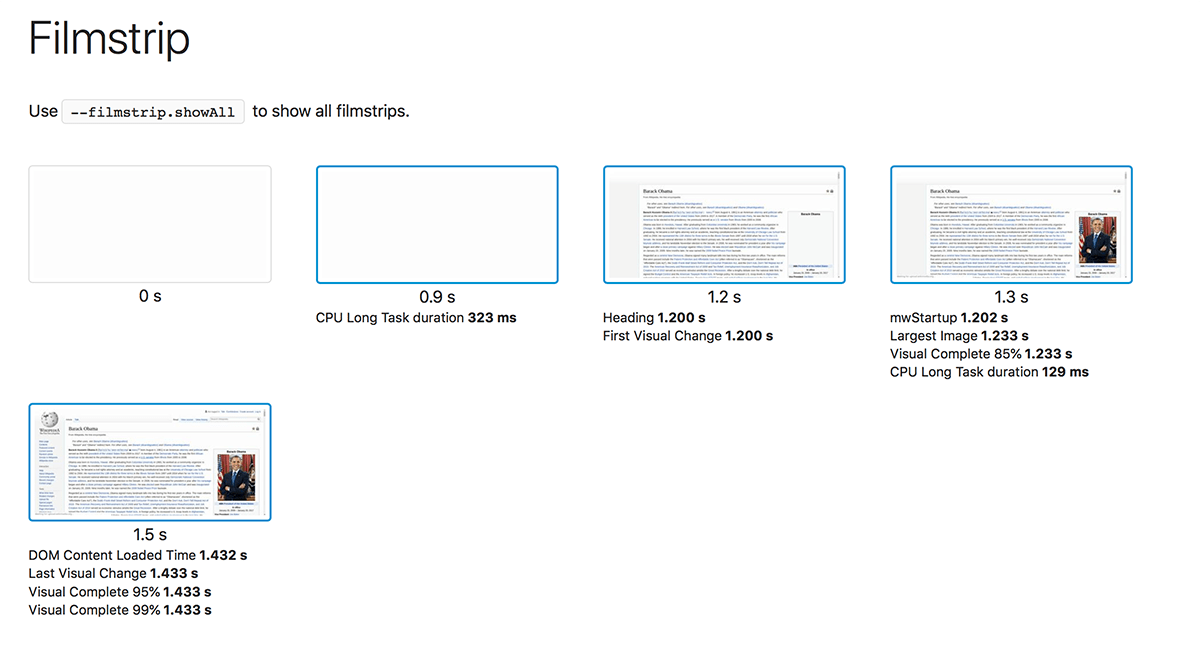
One neat feature is that we show when the long tasks happen in the filmstrip view. That makes it easier for you as a developer to show the impact of the long tasks to your boss.
But what about that magic number of 50 ms? Well, it is possible that 50 ms isn't the right number for you. By default a long task is >50ms. Want to change that? Use --minLongTaskLength to set it yourself (it needs to be larger than 50 ms though).
Total Blocking Time
The Total Blocking Time (TBT) metric measures the total amount of time between First Contentful Paint (FCP) and when you end your test, where the main thread was blocked for long enough to prevent input responsiveness.
You will automatically get this metric if you enable collecting long tasks.
First Input Delay
First Input Delay measures the time from when a user first interacts with your site, such as clicking a button, to the time when the browser is actually able to respond to that interaction. To get that, you need to interact with a page, and you do that with scripting.
We have a special section in the documentation for scripting that guides you on how to do that.
Max Potential First Input Delay
Max Potential First Input Delay measures the worst-case First Input Delay that your users might experience while the page is loading. You will get that metric by enabling collection of long tasks.
Throttle the CPU
Throttle the CPU using Chrome with --chrome.CPUThrottlingRate. This enables CPU throttling to emulate slow CPUs. The throttling rate is a slowdown factor (1 is no throttle, 2 is 2x slowdown, etc.).