Documentation / Configure the HTML output
Configure the HTML output
You can configure some parts of the HTML report that is generated by sitespeed.io.
Configure page metrics
When you test, the pages page is generated where you can compare all the URLs that have been tested. By default we cherry-picked a couple of metrics that show in the table, but you can also change them. This is useful if there is a specific metric that is your main focus.
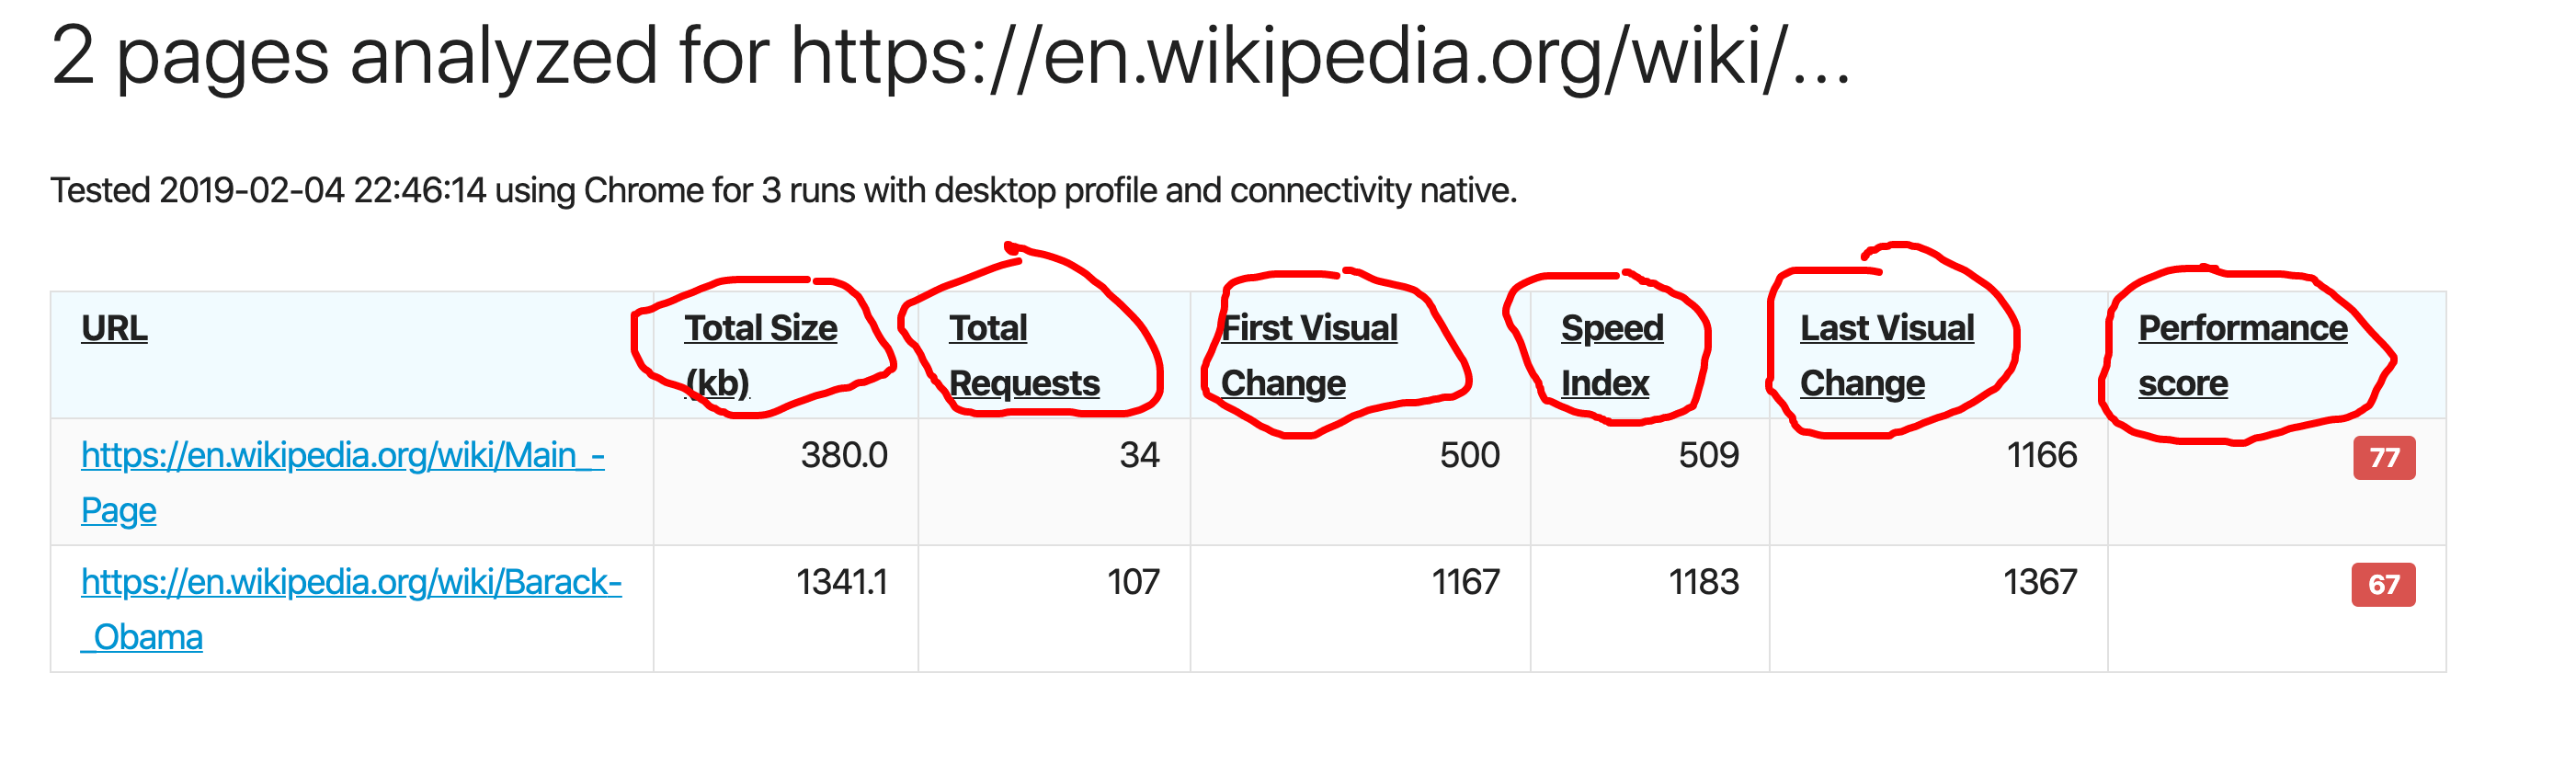
You can configure which metrics to show in the columns with the --html.pageSummaryMetrics CLI parameter. Pass it multiple times to add multiple columns or use the JSON configuration file and create an array with the metrics you want to use.
docker run --rm -v "$(pwd):/sitespeed.io" sitespeedio/sitespeed.io:41.3.3 --html.pageSummaryMetrics timings.pageLoadTime --html.pageSummaryMetrics requests.total https://www.sitespeed.io Or use a configuration json:
"html": {
    "pageSummaryMetrics": [
      "transferSize.total",
      "requests.total",
      "thirdParty.requests",
      "transferSize.javascript",
      "transferSize.css",
      "transferSize.image",
      "score.performance"
    ]
}
Which metric can you use? It is the same setup as when you create a budget file. At the moment you can choose between these metrics.
Let us know if there are any metrics that you are missing!
Configure page summary boxes
The summary boxes on the start page are also configurable. You can choose which metrics to show.
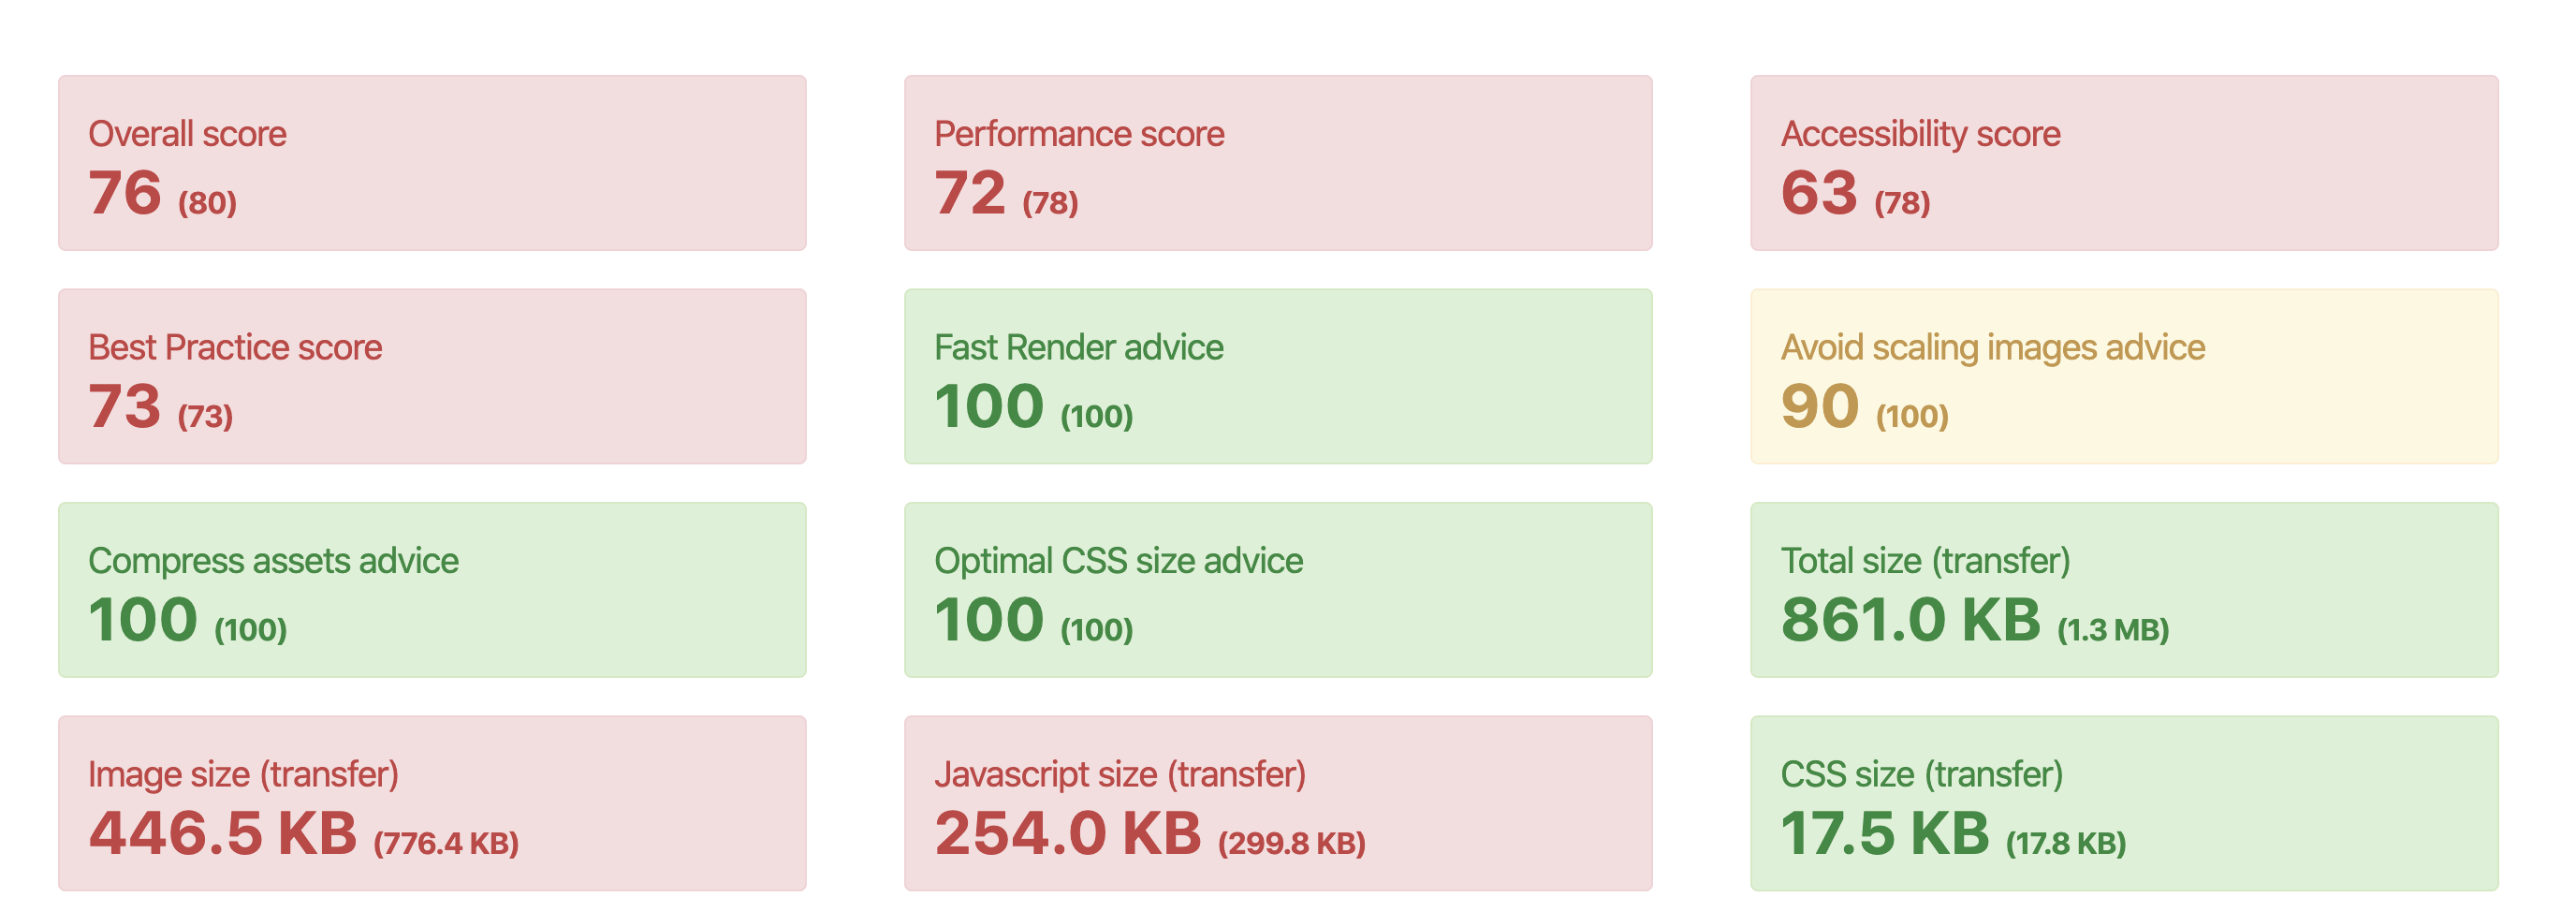
It follows the same pattern as page columns and uses the same friendly names.
docker run --rm -v "$(pwd):/sitespeed.io" sitespeedio/sitespeed.io:41.3.3 --html.summaryBoxes timings.pageLoadTime --html.summaryBoxes requests.total https://www.sitespeed.io Or use a configuration json:
"html": {
    "summaryBoxes": [
      "transferSize.total",
      "requests.total",
      "thirdParty.requests",
      "transferSize.javascript",
      "transferSize.css",
      "transferSize.image",
      "score.performance"
    ]
}
Configure the thresholds for red/yellow/green summary boxes
You can override the default configuration that defines the colors of the summary boxes. The default code is set here and is a good starting point for what you can set.
Define your JSON file with the limits and feed it to sitespeed.io with --html.summaryBoxesThresholds.
Say that you are testing on a slow 3g connection and the default settings for first paint are unrealistic (1000 ms for green and over 2000 gives you red). Create a JSON file and name it summaryLimits.json:
{
    "timings": {
        "firstPaint": {
            "green": 2000,
            "yellow": 4000
        }
    }
}
And then run:
docker run --rm -v "$(pwd):/sitespeed.io" sitespeedio/sitespeed.io:41.3.3 --html.summaryBoxesThresholds summaryLimits.json https://www.sitespeed.io Configurable metrics
Here are the different metrics that you can show in the summary boxes or in the page HTML. Any metric missing? Make a PR or create an issue!
googleWebVitals.timeToFirstByte
googleWebVitals.firstContentfulPaint
googleWebVitals.largestContentfulPaint
googleWebVitals.interactionToNextPaint
googleWebVitals.totalBlockingTime
googleWebVitals.cumulativeLayoutShift
timings.firstPaint
timings.firstContentfulPaint
timings.largestContentfulPaint
timings.loadEventEnd
timings.fullyLoaded
timings.serverResponseTime
timings.backEndTime
timings.pageLoadTime
timings.FirstVisualChange
timings.LastVisualChange
timings.SpeedIndex
timings.ContentfulSpeedIndex
timings.PerceptualSpeedIndex
timings.VisualReadiness
timings.VisualComplete95
timings.VisualComplete99
timings.VisualComplete
cpu.totalBlockingTime
cpu.maxPotentialFid
cpu.longTasks
cpu.longTasksTotalDuration
browser.cpuBenchmark
pageinfo.cumulativeLayoutShift
pageinfo.domElements
pageinfo.documentHeight
requests.total
requests.html
requests.javascript
requests.css
requests.image
requests.font
requests.httpErrors
transferSize.total
transferSize.html
transferSize.javascript
transferSize.css
transferSize.image
transferSize.font
transferSize.favicon
transferSize.json
transferSize.other
transferSize.plain
transferSize.svg
contentSize.total
contentSize.html
contentSize.javascript
contentSize.css
contentSize.image
contentSize.font
contentSize.favicon
contentSize.json
contentSize.other
contentSize.plain
contentSize.svg
thirdParty.transferSize
thirdParty.requests
firstParty.requests
firstParty.transferSize
firstParty.contentSize
score.score
score.bestpractice
score.privacy
score.performance
lighthouse.performance
lighthouse.accessibility
lighthouse.best-practices
lighthouse.seo
lighthouse.pwa
gpsi.performance
gpsi.accessibility
gpsi.best-practices
gpsi.seo
gpsi.pwa
sustainable.totalCO2
sustainable.co2PerPageView
sustainable.co2FirstParty
sustainable.co2ThirdParty
axe.critical
axe.serious
axe.minor
axe.moderate
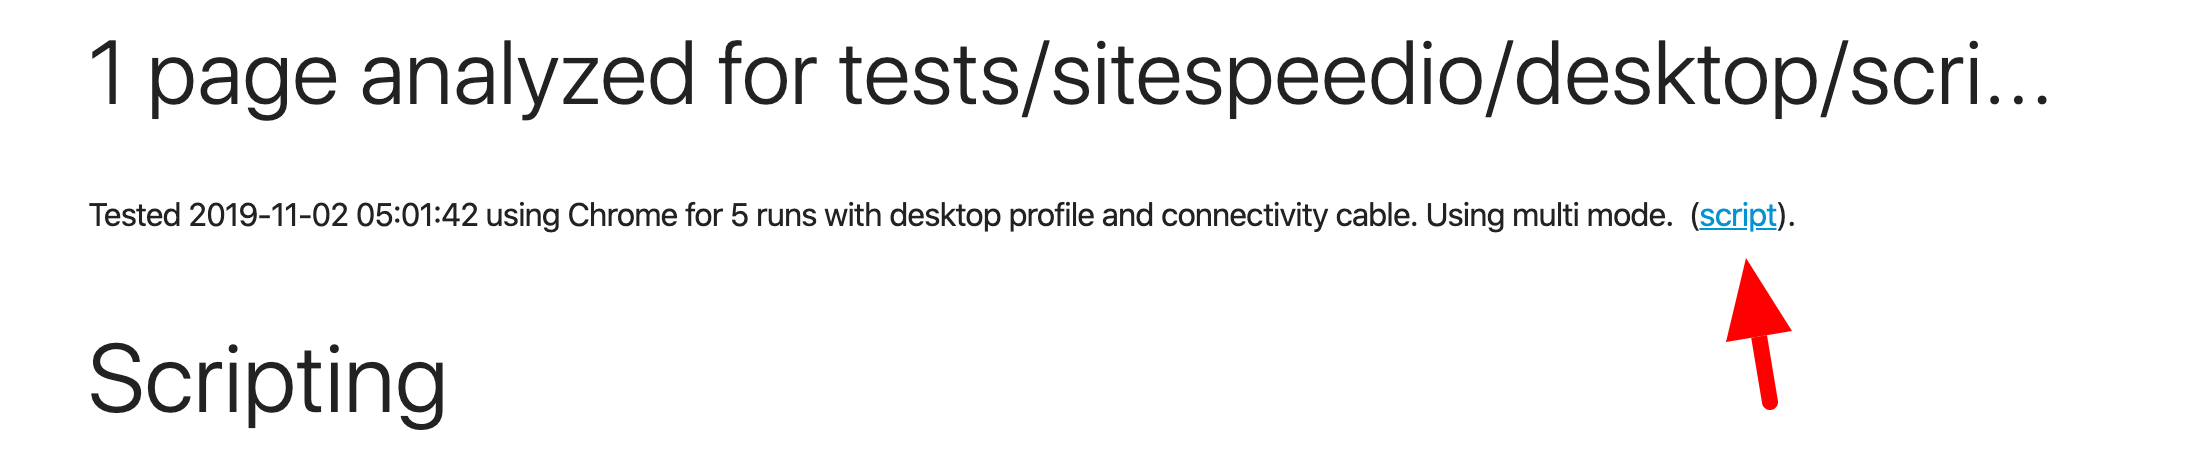
Show your script in the HTML output
If you are running tests using scripting it can sometimes be hard to know what you are actually testing when you look at the HTML result. Then add --html.showScript to include a link on the result page.
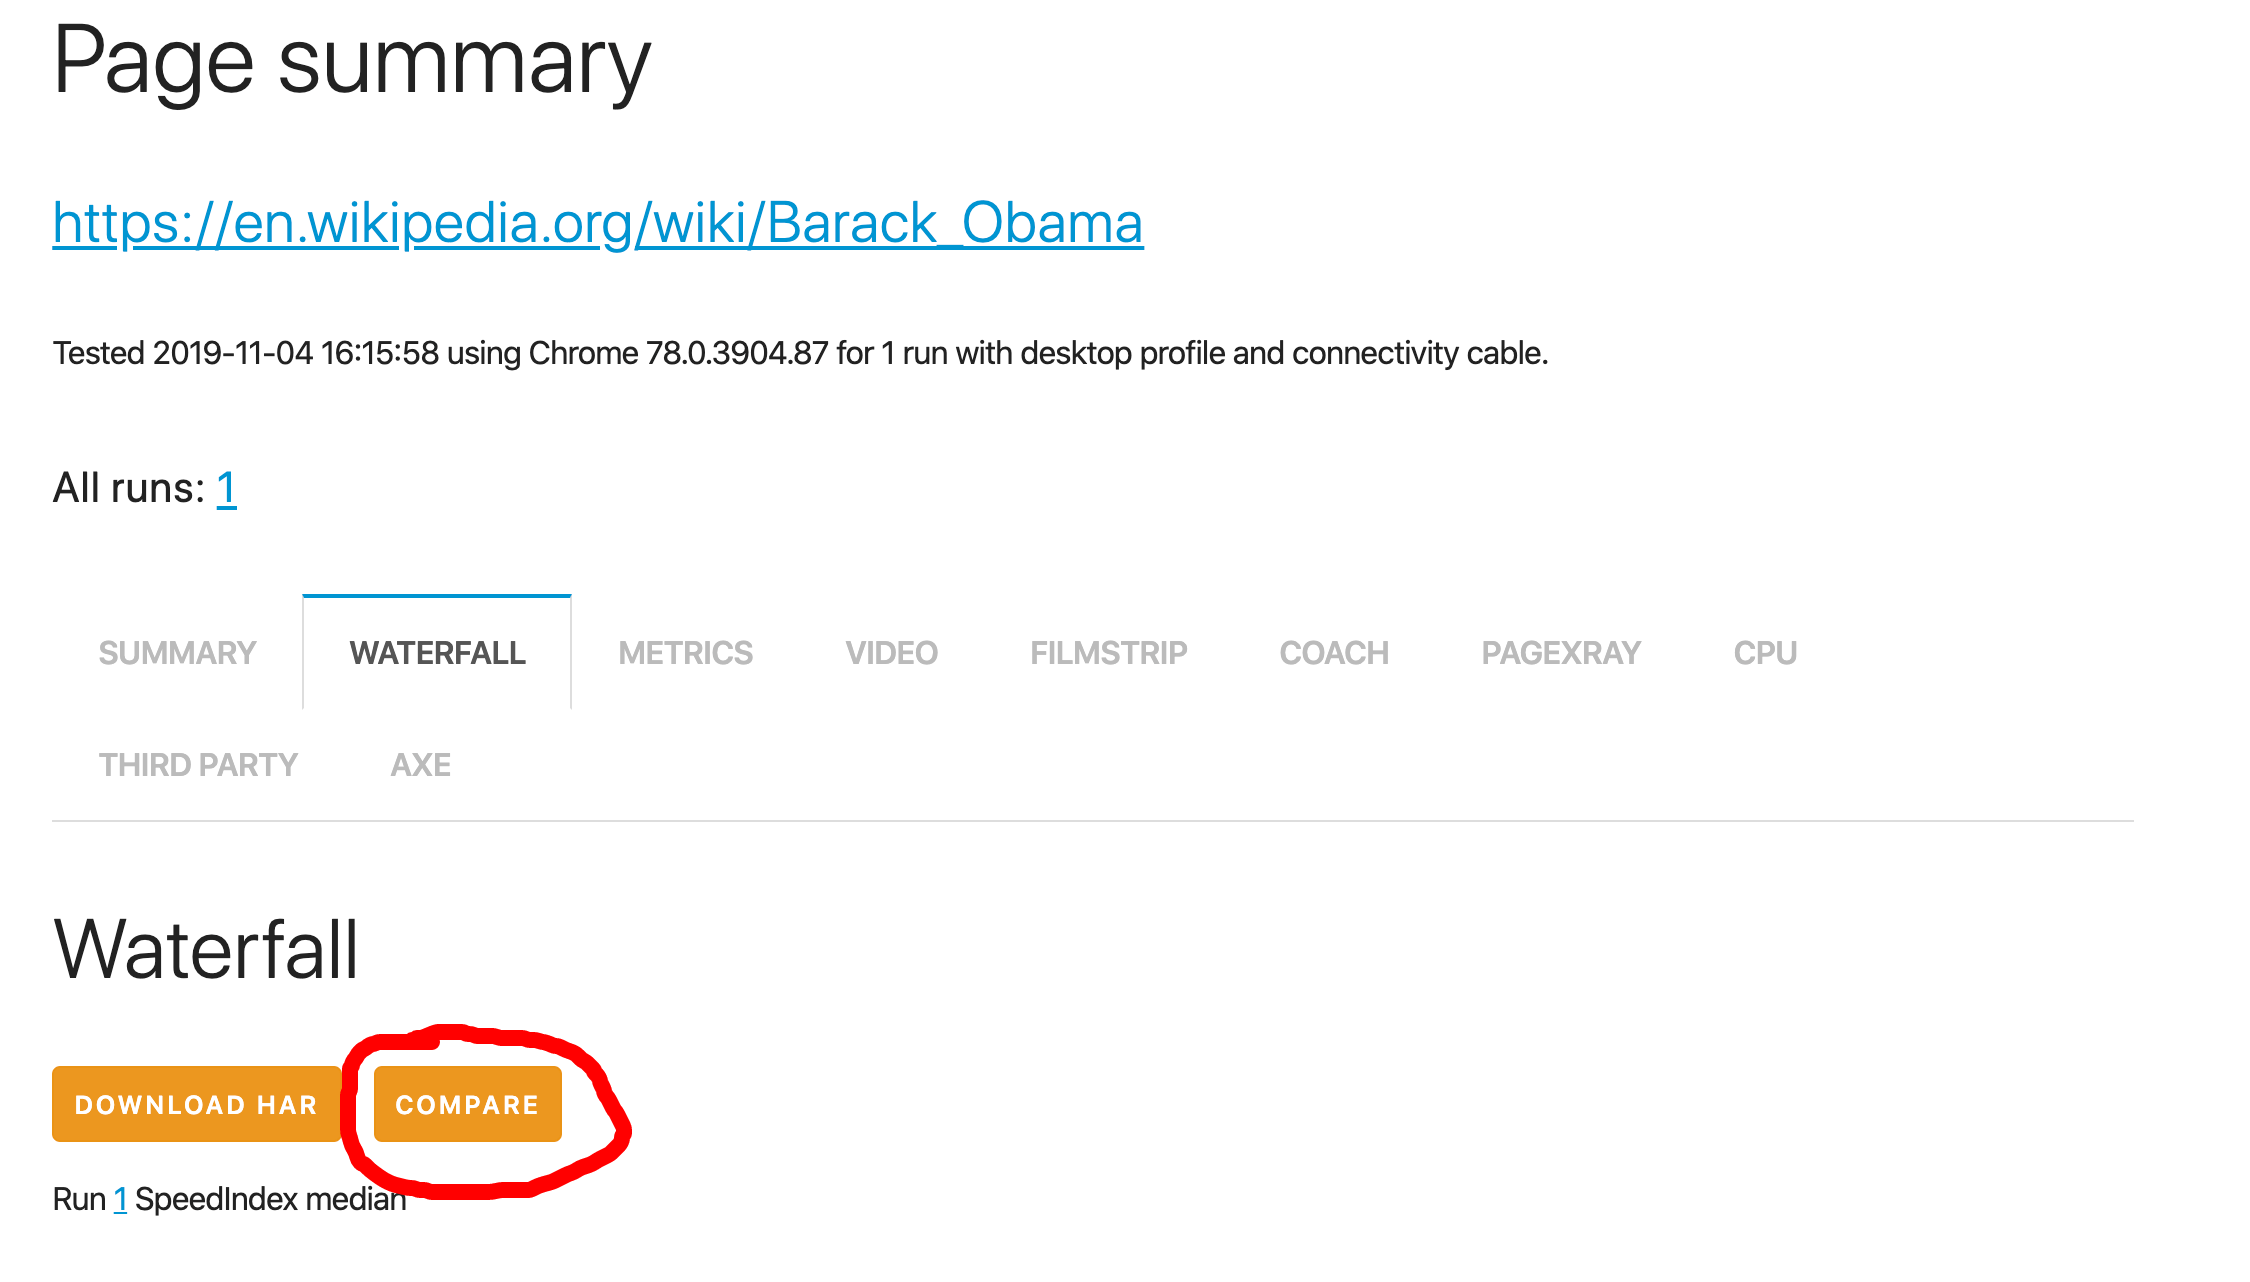
Link to open your HAR files in compare
If you push your result HTML pages to S3 or another public server, you can use https://compare.sitespeed.io or your own deployed version of compare to compare your HAR files.
You add the link to the HTML result with --html.compareURL https://compare.sitespeed.io/ and you will then have a button in your result where you can compare your HAR file.
Make sure that your server has correct CORS settings so that compare.sitespeed.io (or your own server) can get the HAR file.