Documentation / Alerts
Alerts
One of the best use cases with sending metrics to Graphite/InfluxDB and using Grafana is creating performance alerts that will alert you when SpeedIndex, First Visual Change or other metrics regress on your site. Grafana supports many different notification types and you can alert on all metrics that you send to Graphite/Grafana or if you have your own storage for metrics. This means you can alert on metrics from Browsertime like SpeedIndex and First/Last Visual Change, and all other plugins that sends data to your storage (WebPageTest, Coach, PageXray and ChromeTrace).
Before you start, read the Grafana alerts documentation.
Setup #
There’s a couple of ways to create queries and alerts:
- You want to create queries that measure the change in percentage over time and you want to create an alert when all of them are above a specific percentage.
- Or you can fire alerts when a metric difference has been over a specific value for X amount of time.
Create percentage queries #
Here we test three URLs, and if the change is larger than 3% on all three URLs, an alert is fired. We test three URLs to make sure the change is for multiple URLs and not specific to one URL. The limit of when to fire the alert depends on how stable metrics you have (how stable is your website, do you test with proxy, how large is server instance where you run the browser etc).
In the left part of the image you see a horizontal red line, that is when an alert is fired (sending an email/posting to Slack, PagerDuty etc). The green line is when the numbers are back to normal. In the right graph you can see the change in numbers.
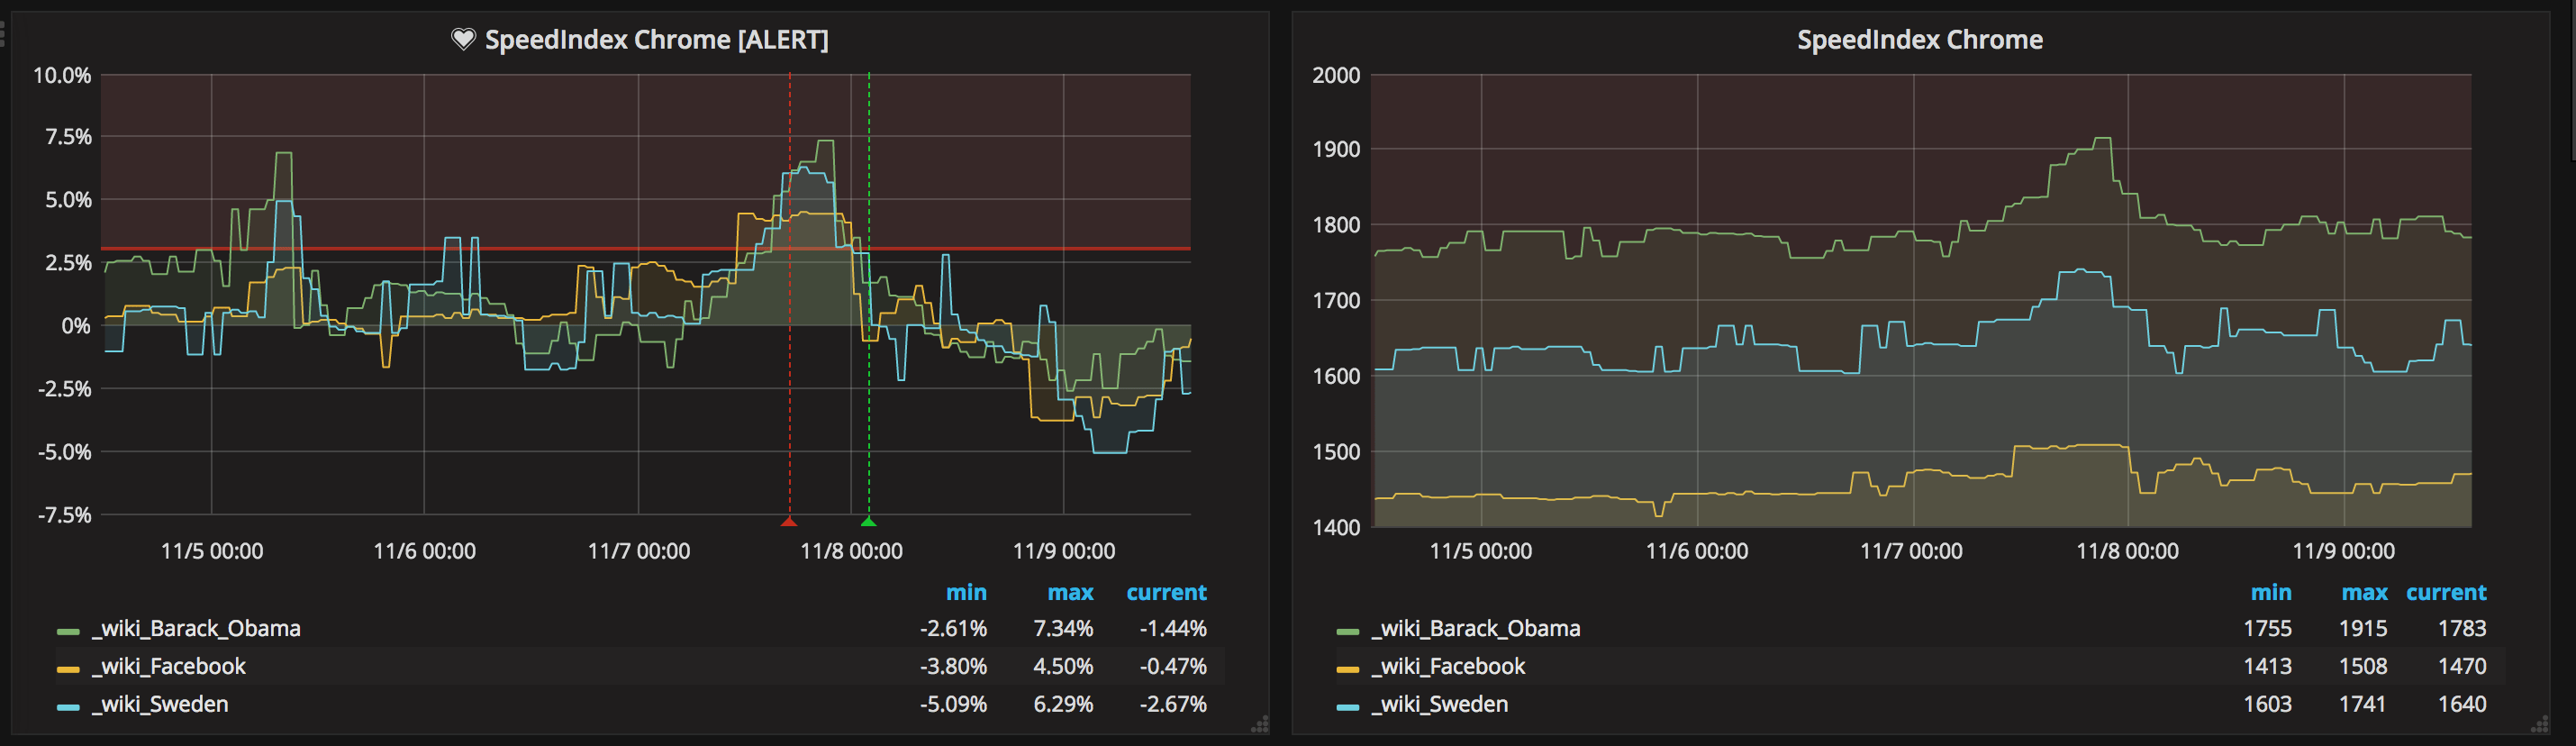
To the left we have changes in percentage. These are the numbers where we add alerts. In this case we first create a query and take the moving median one day back (this is the number we will use and compare with) and then we take the moving median of the latest 5 hours. Depending on how steady metrics we have, we can do this different. If you run on a stable environment with a proxy you don’t need to take the median of X hours, instead you can take the exact run.
If you have a really unstable environment you can instead have a longer time span.
The queries for the three URLs looks like this:
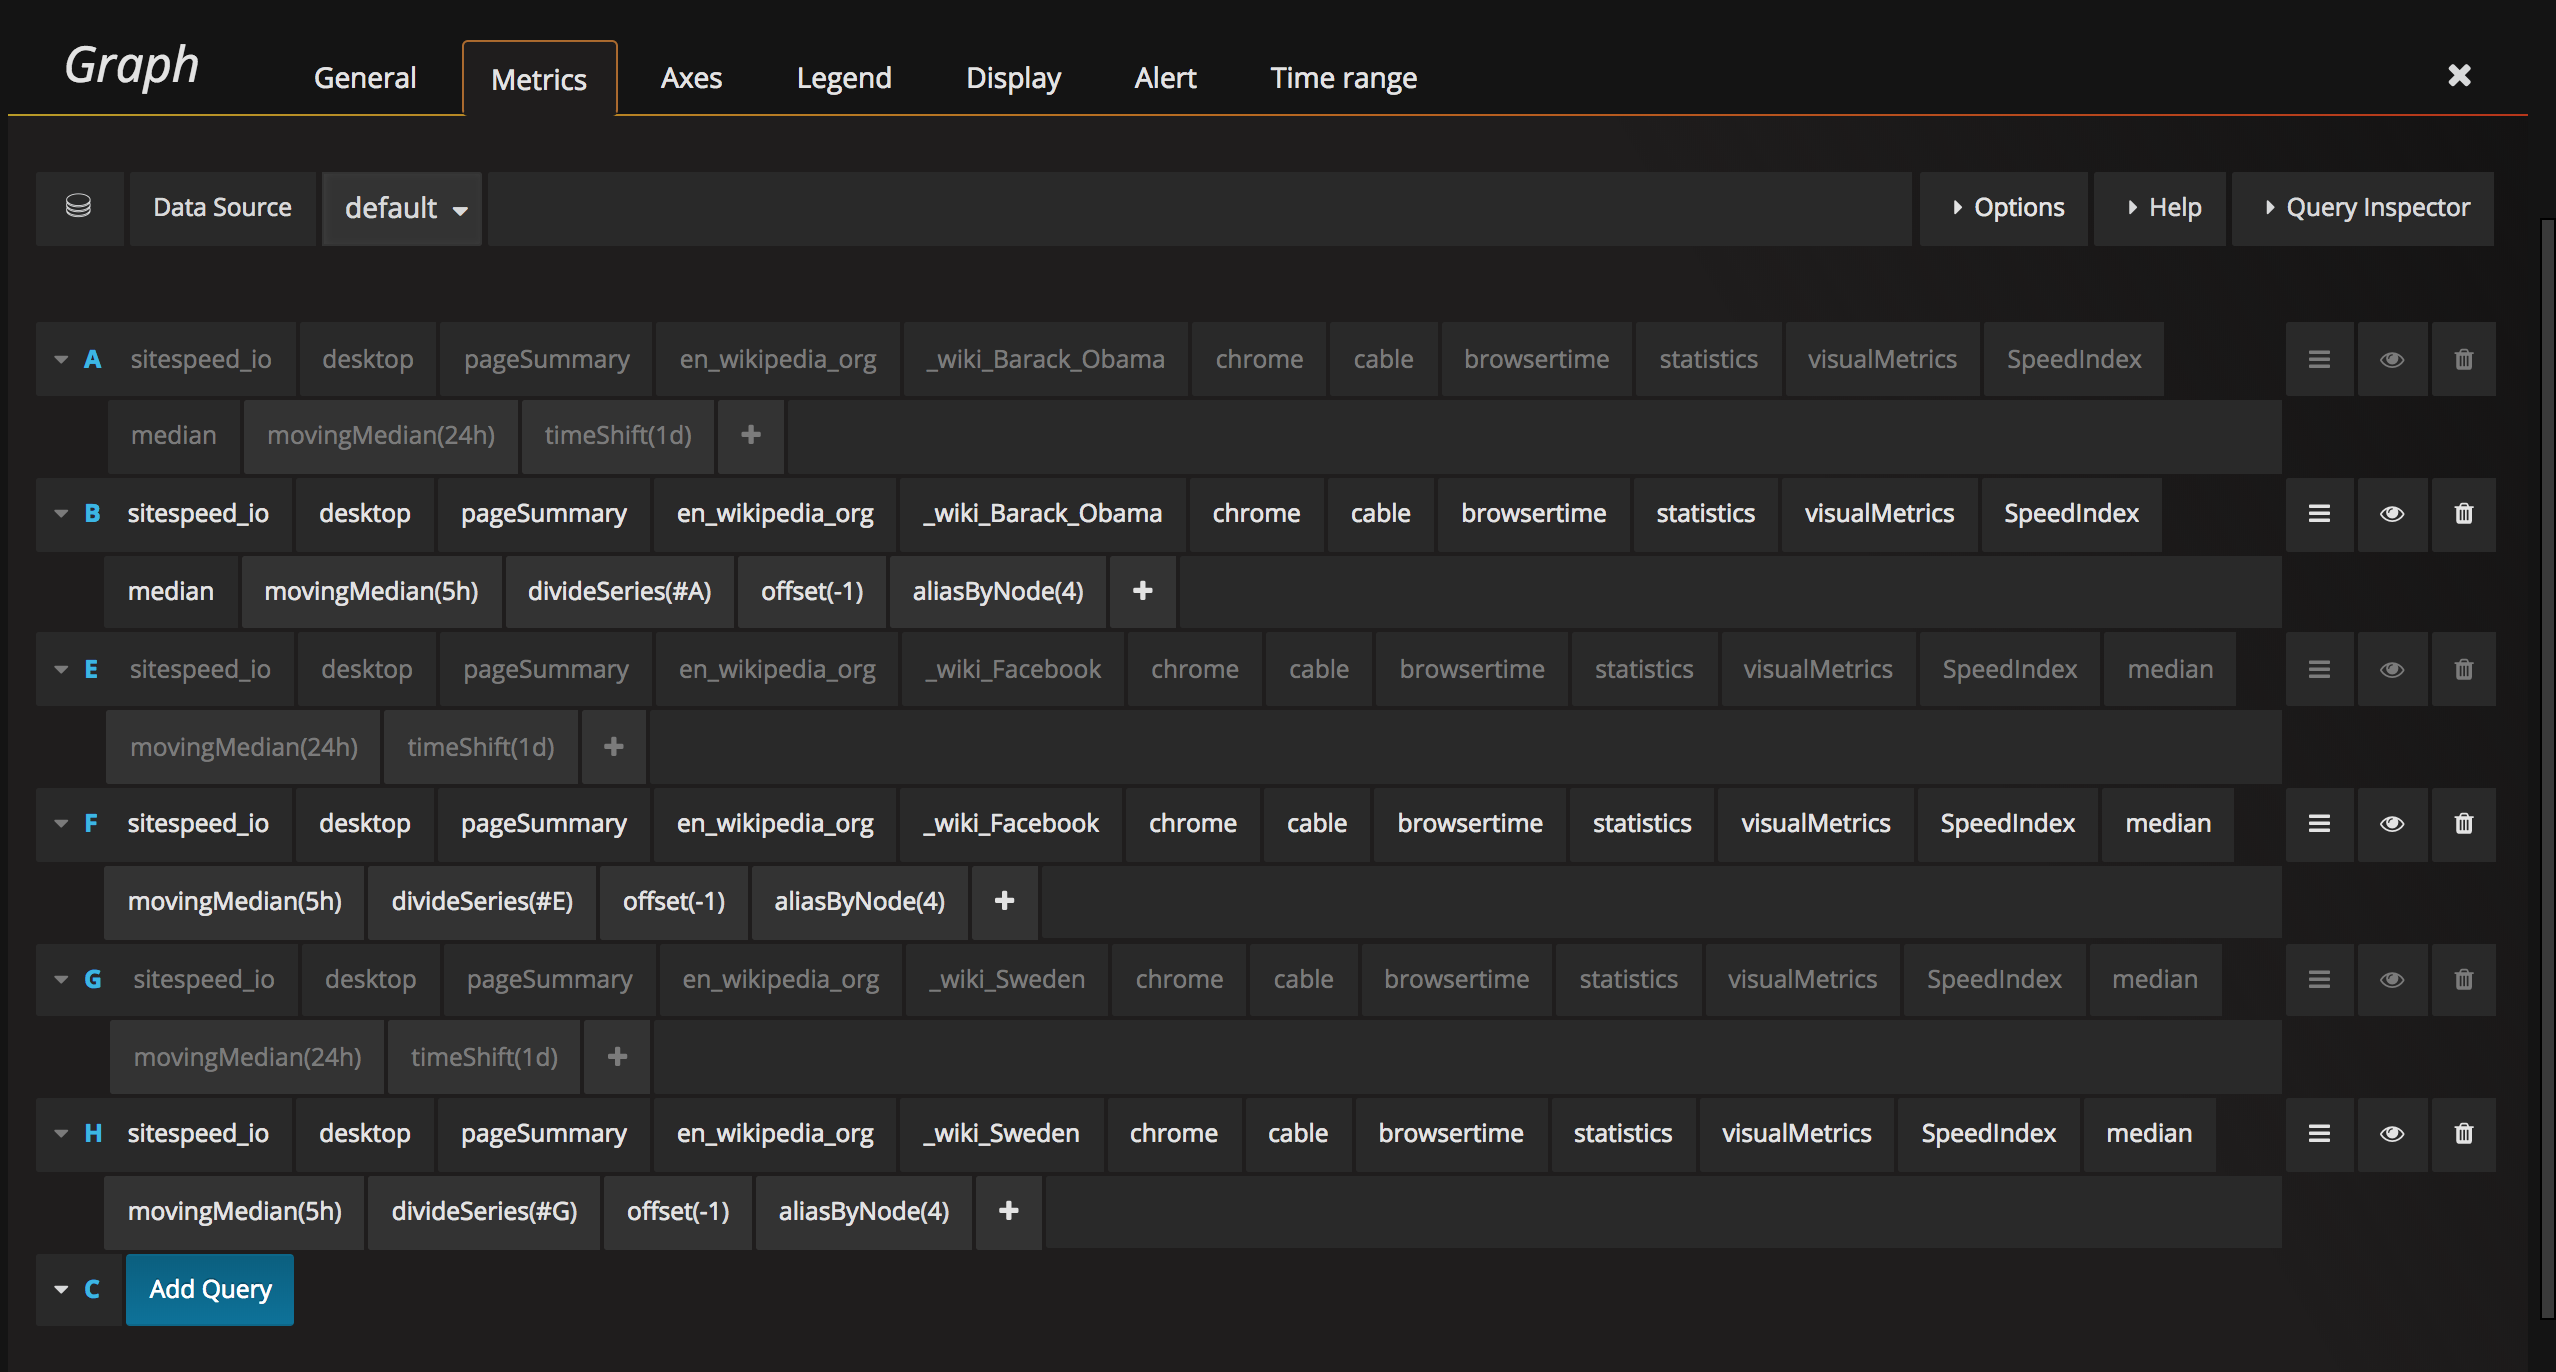
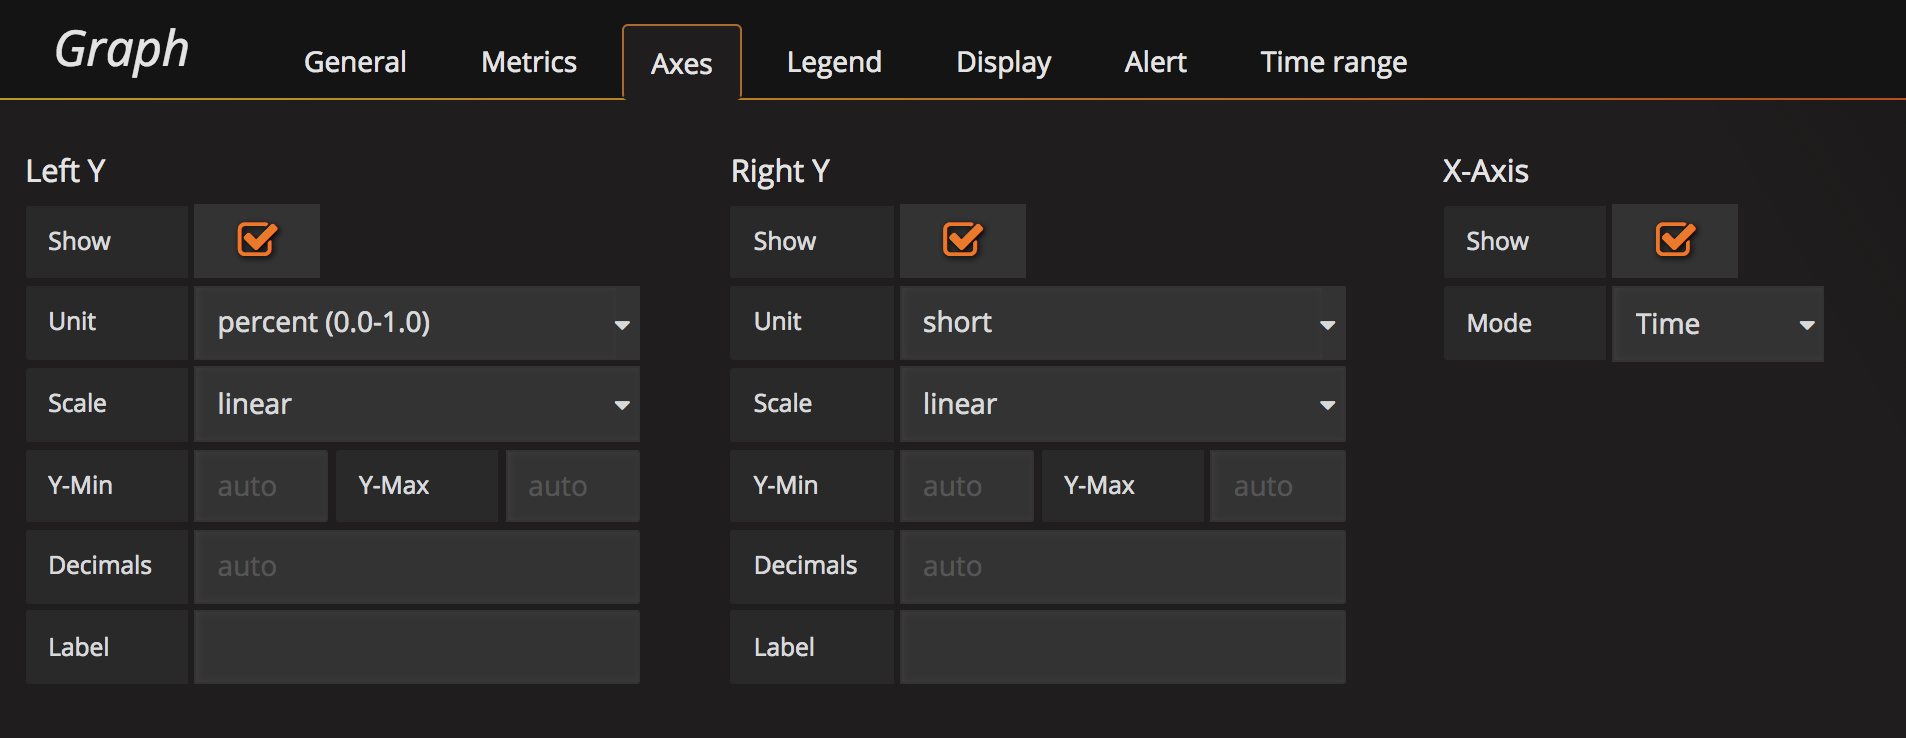
And change the axes unit to show percent: 0.0-1.0.
The alert #
After that you need to create the alert. Take the median, choose a timespan and the percentage when you want to alert. In our example we do AND queries (all URLs must change) but if you are interested in specific URLs changing, you can also do OR alert queries.
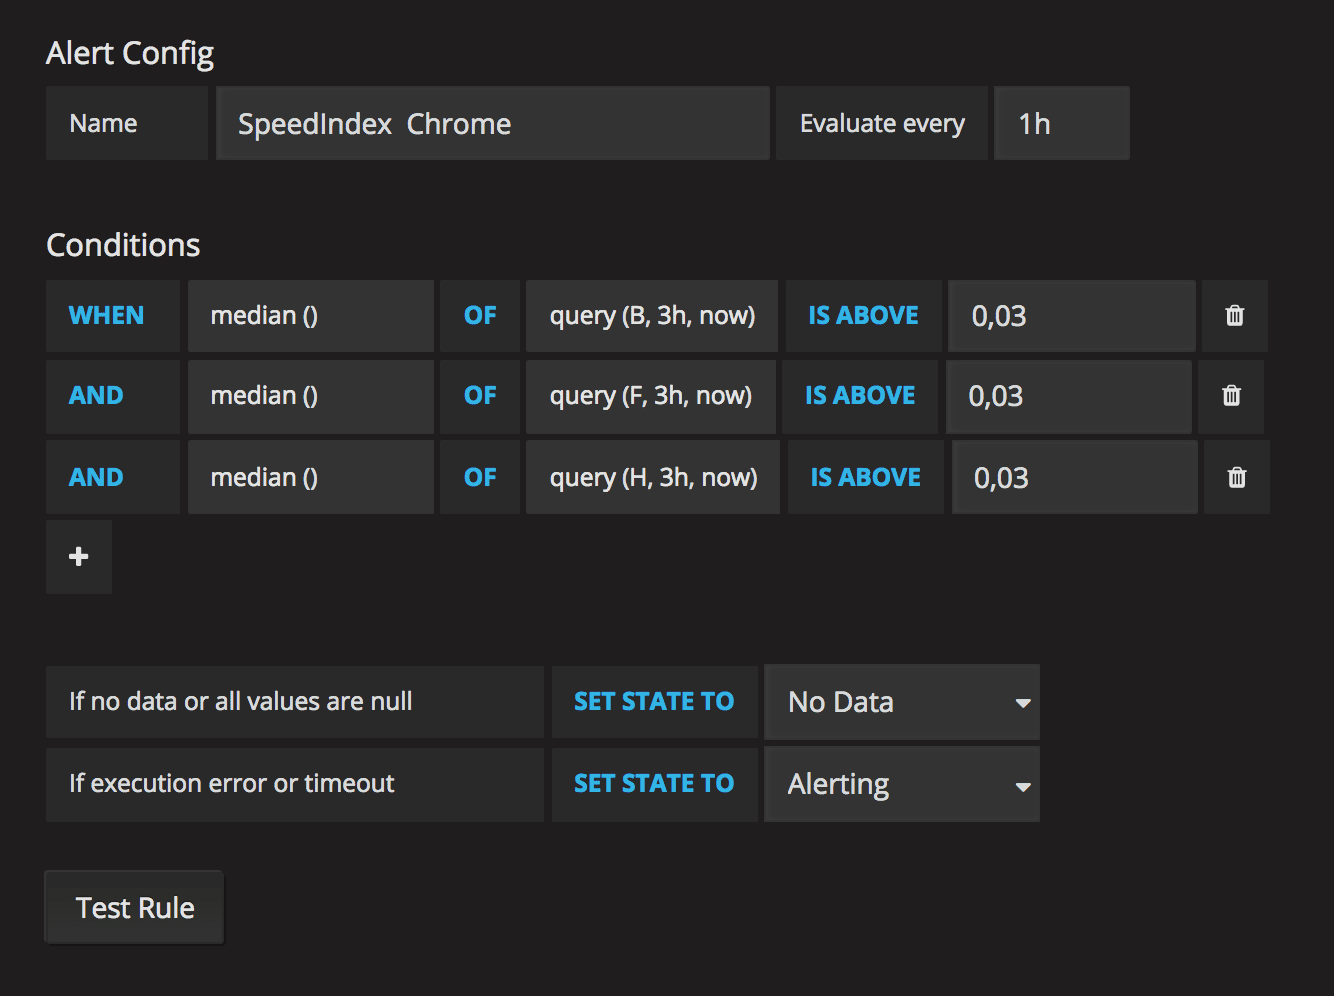
You see that we run the alerts once an hour. It depends on how often you do releases or you content changes. You want to make sure that you catch the alerts within at least couple of hours.
Create metrics queries #
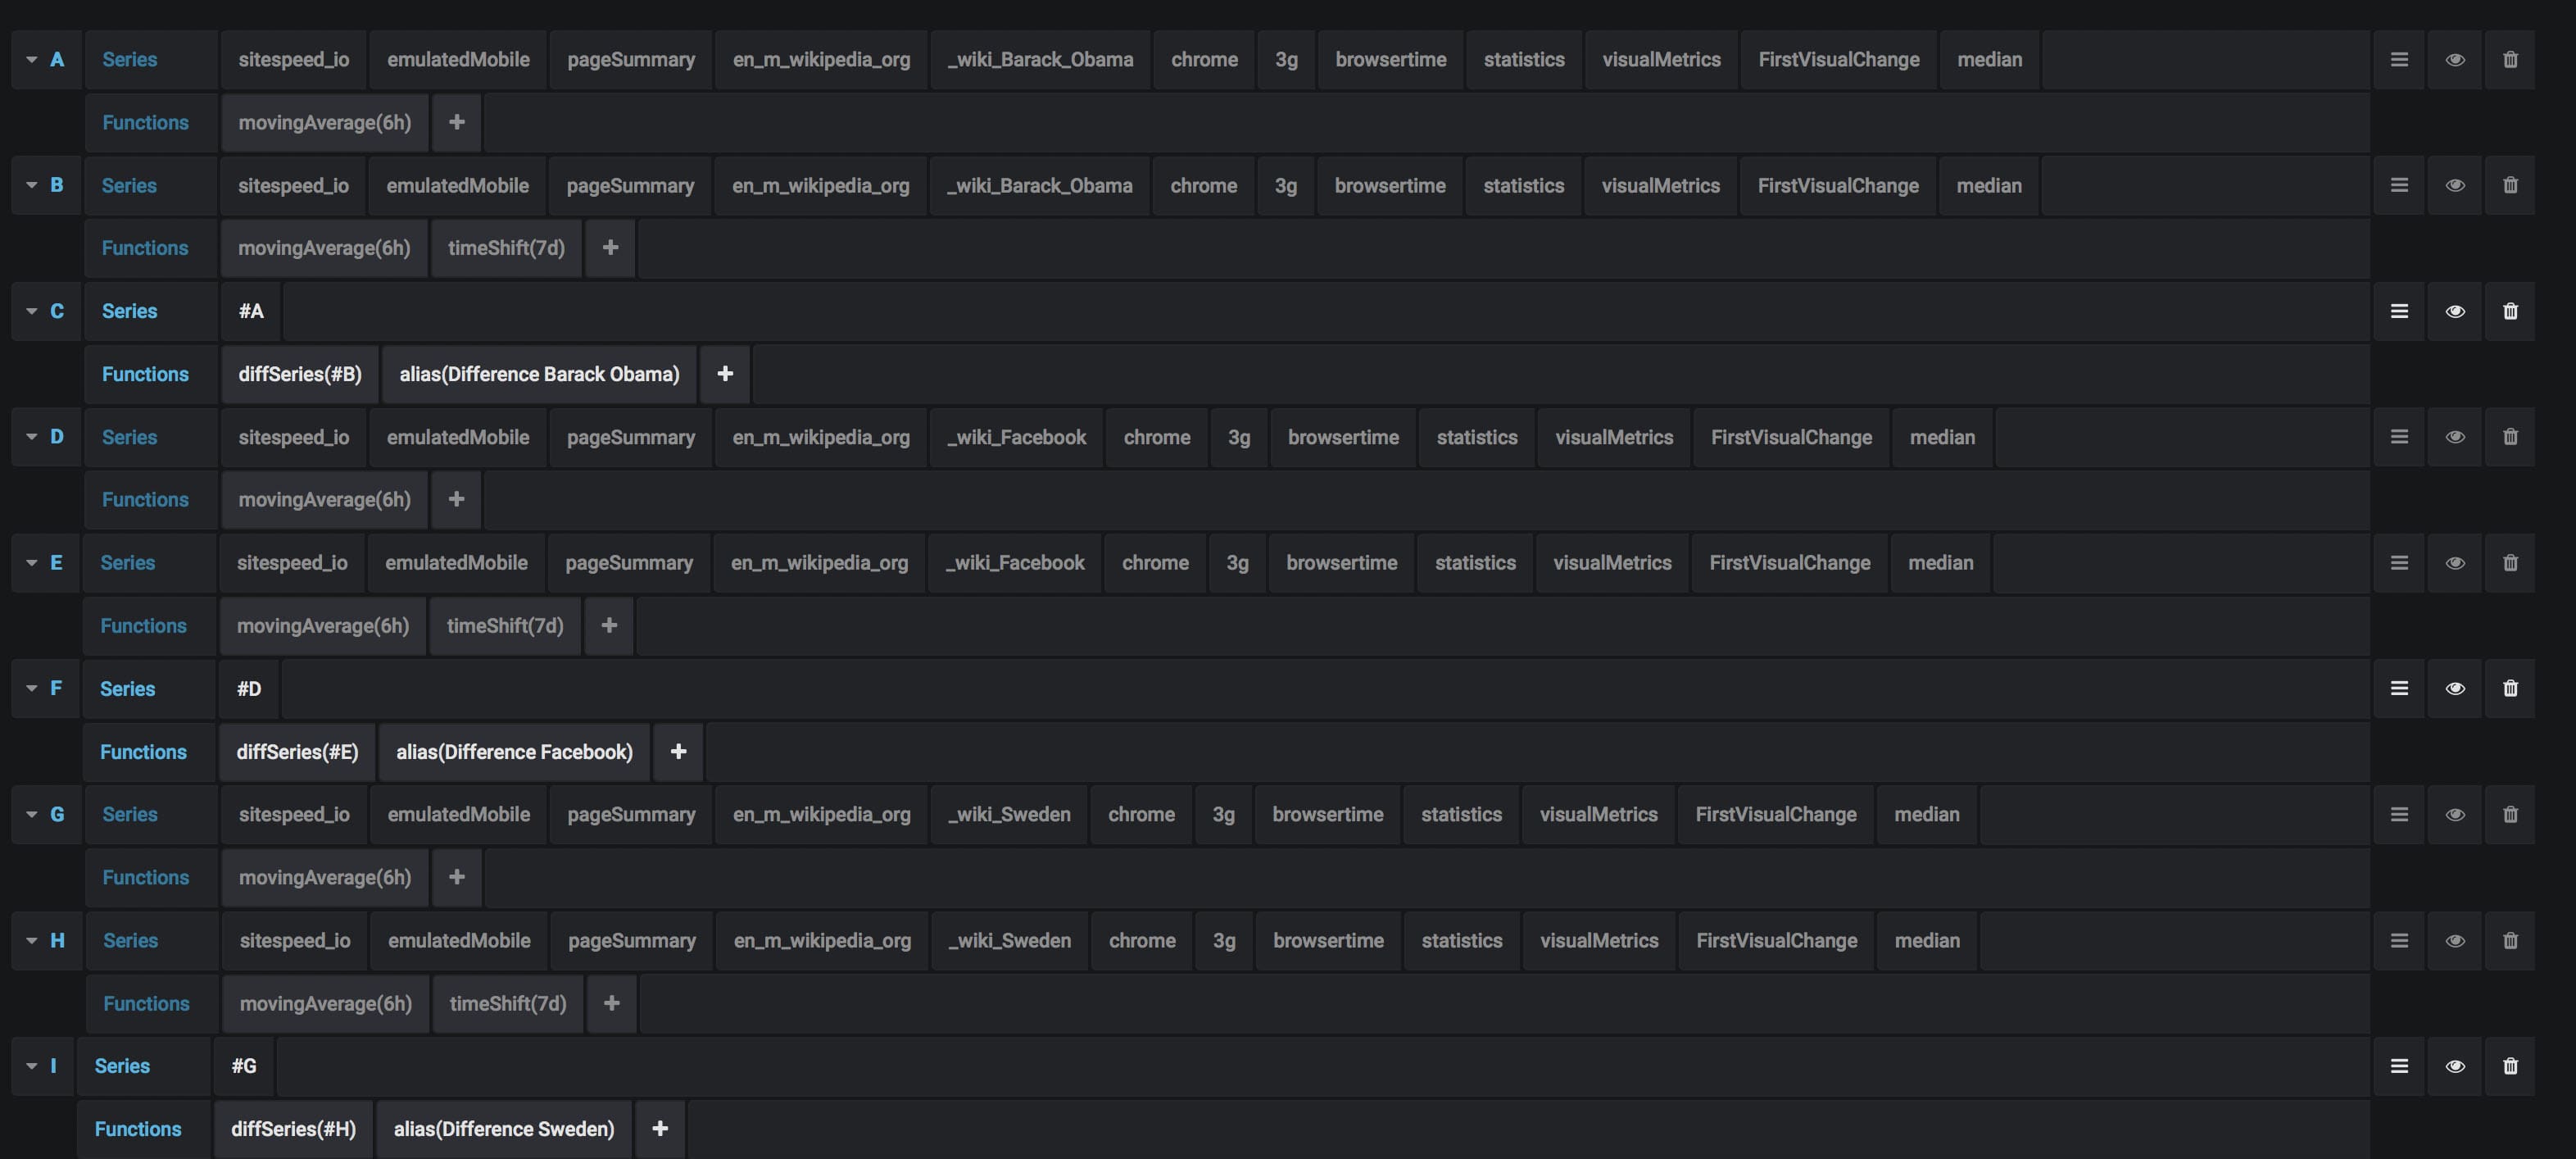
The other way is to create alerts that alerts if a threshold is met. In this example we want to alert if the First Visual Change increased by 20 ms for three URLs. The Graph looks like this:
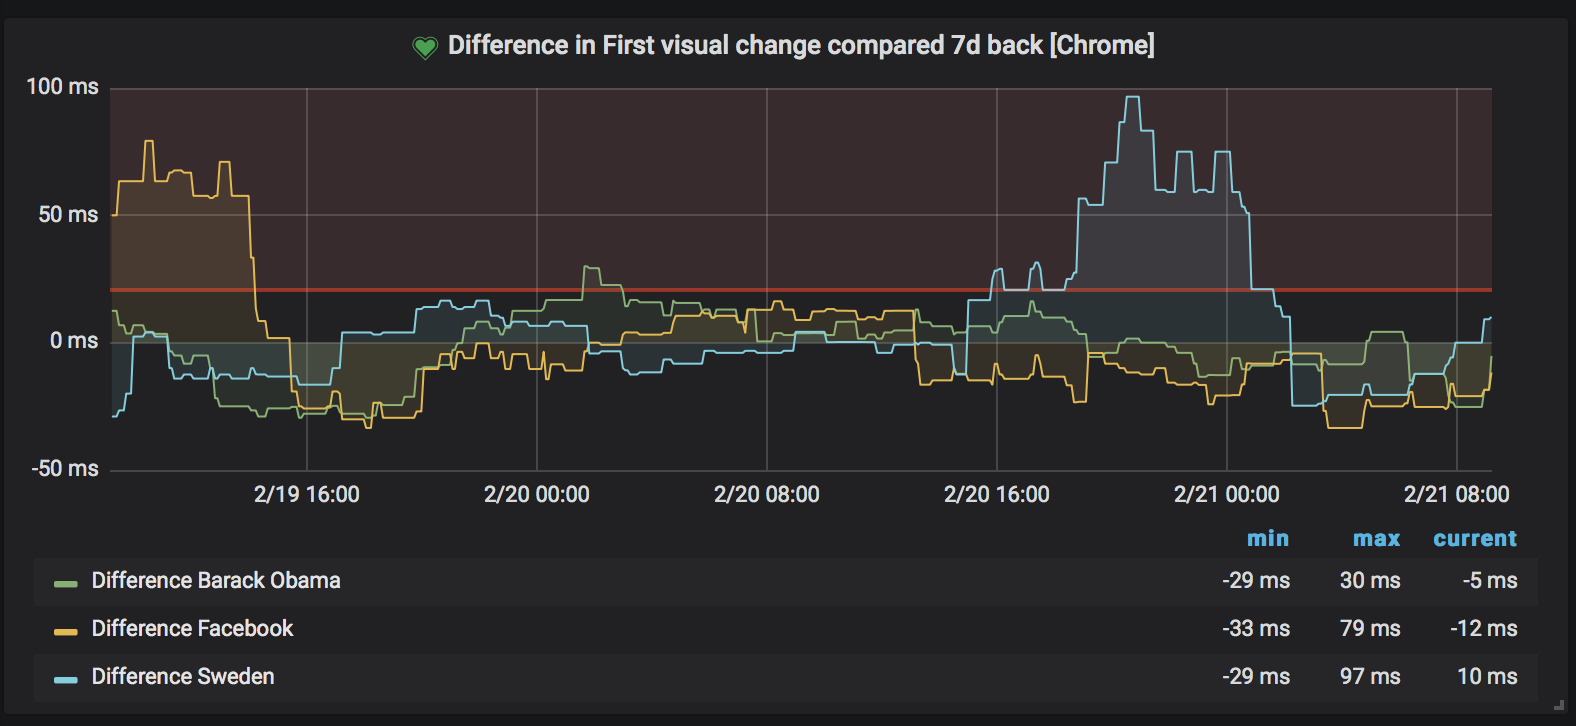
And setting up the graph is more straight forward then using percentages. You get the metric you want, differ the metric with X amount back in time and draw the difference.
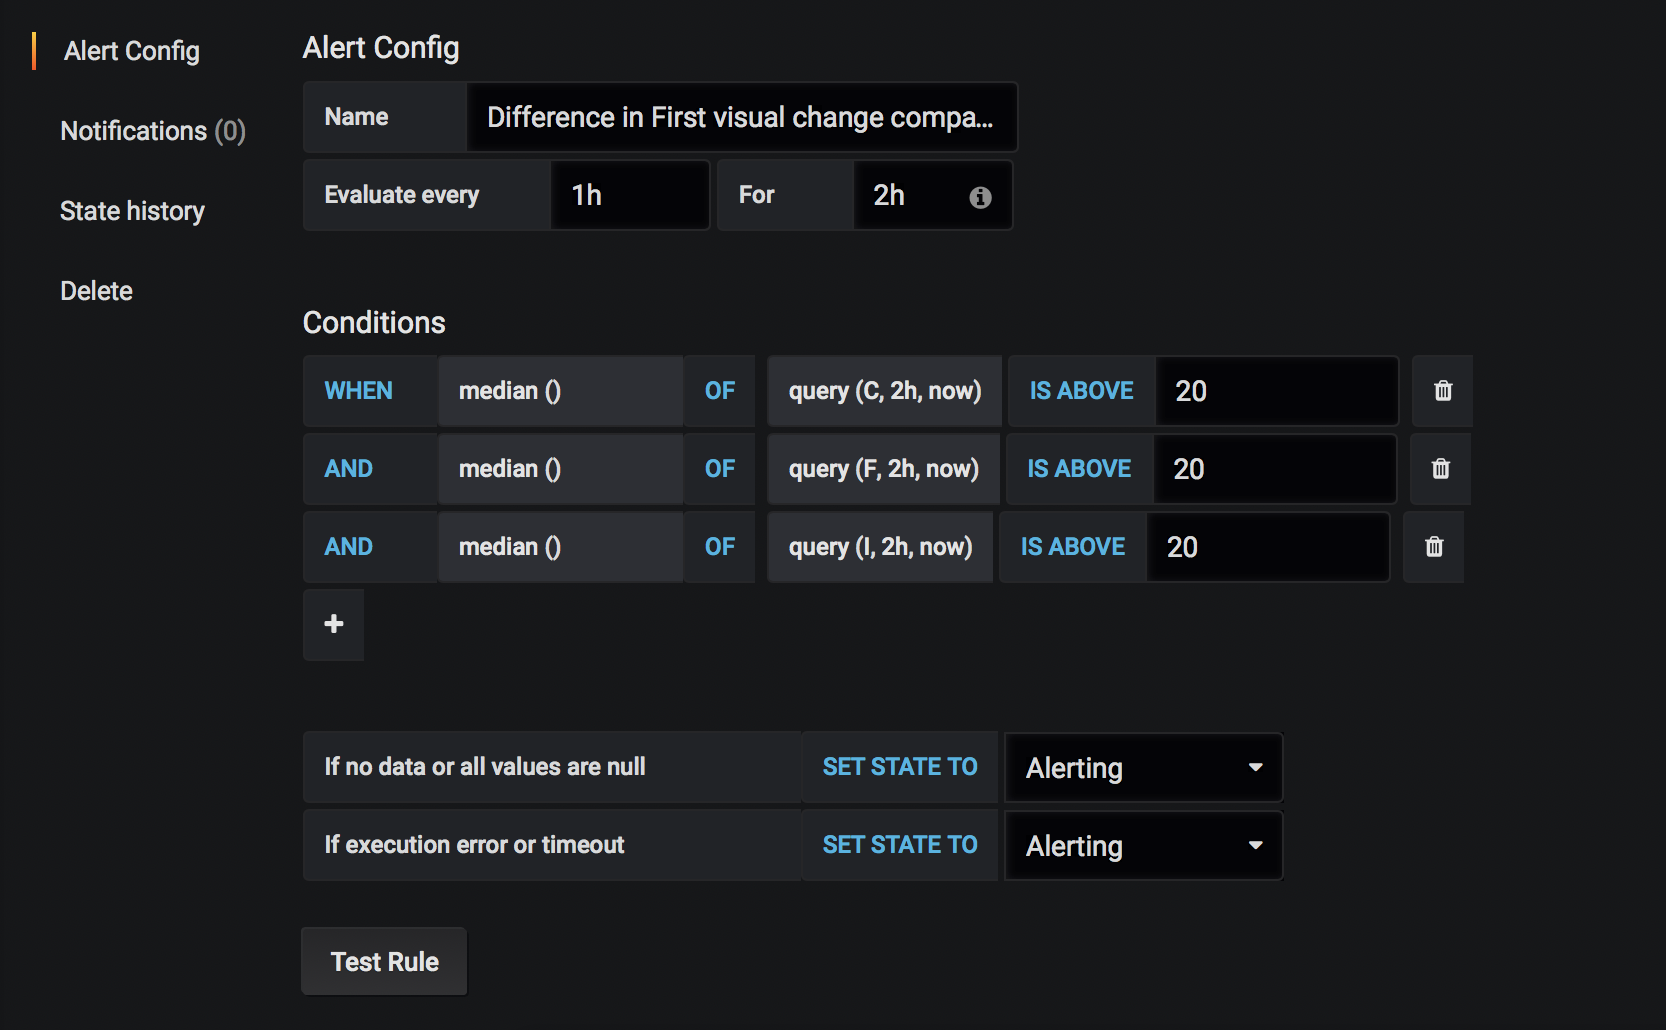
The alert #
Then you setup the alert. In this example we run the alert query once every hour and it needs to fire twice within 2 hours, to actually send an alert. If we then make sure we run our tests at least every hour, we need two runs with higher values that the limit to fire the alert.
History graph #
The history graph is pretty straight forward. You list the metrics you want and you configure how long back in time you want to graph them. We used to do 30 days (that is really good to see trends) but it was to long to see something when an actual regression was happening, now we use 7 days.
We take the moving median but you can try out what works best for you.
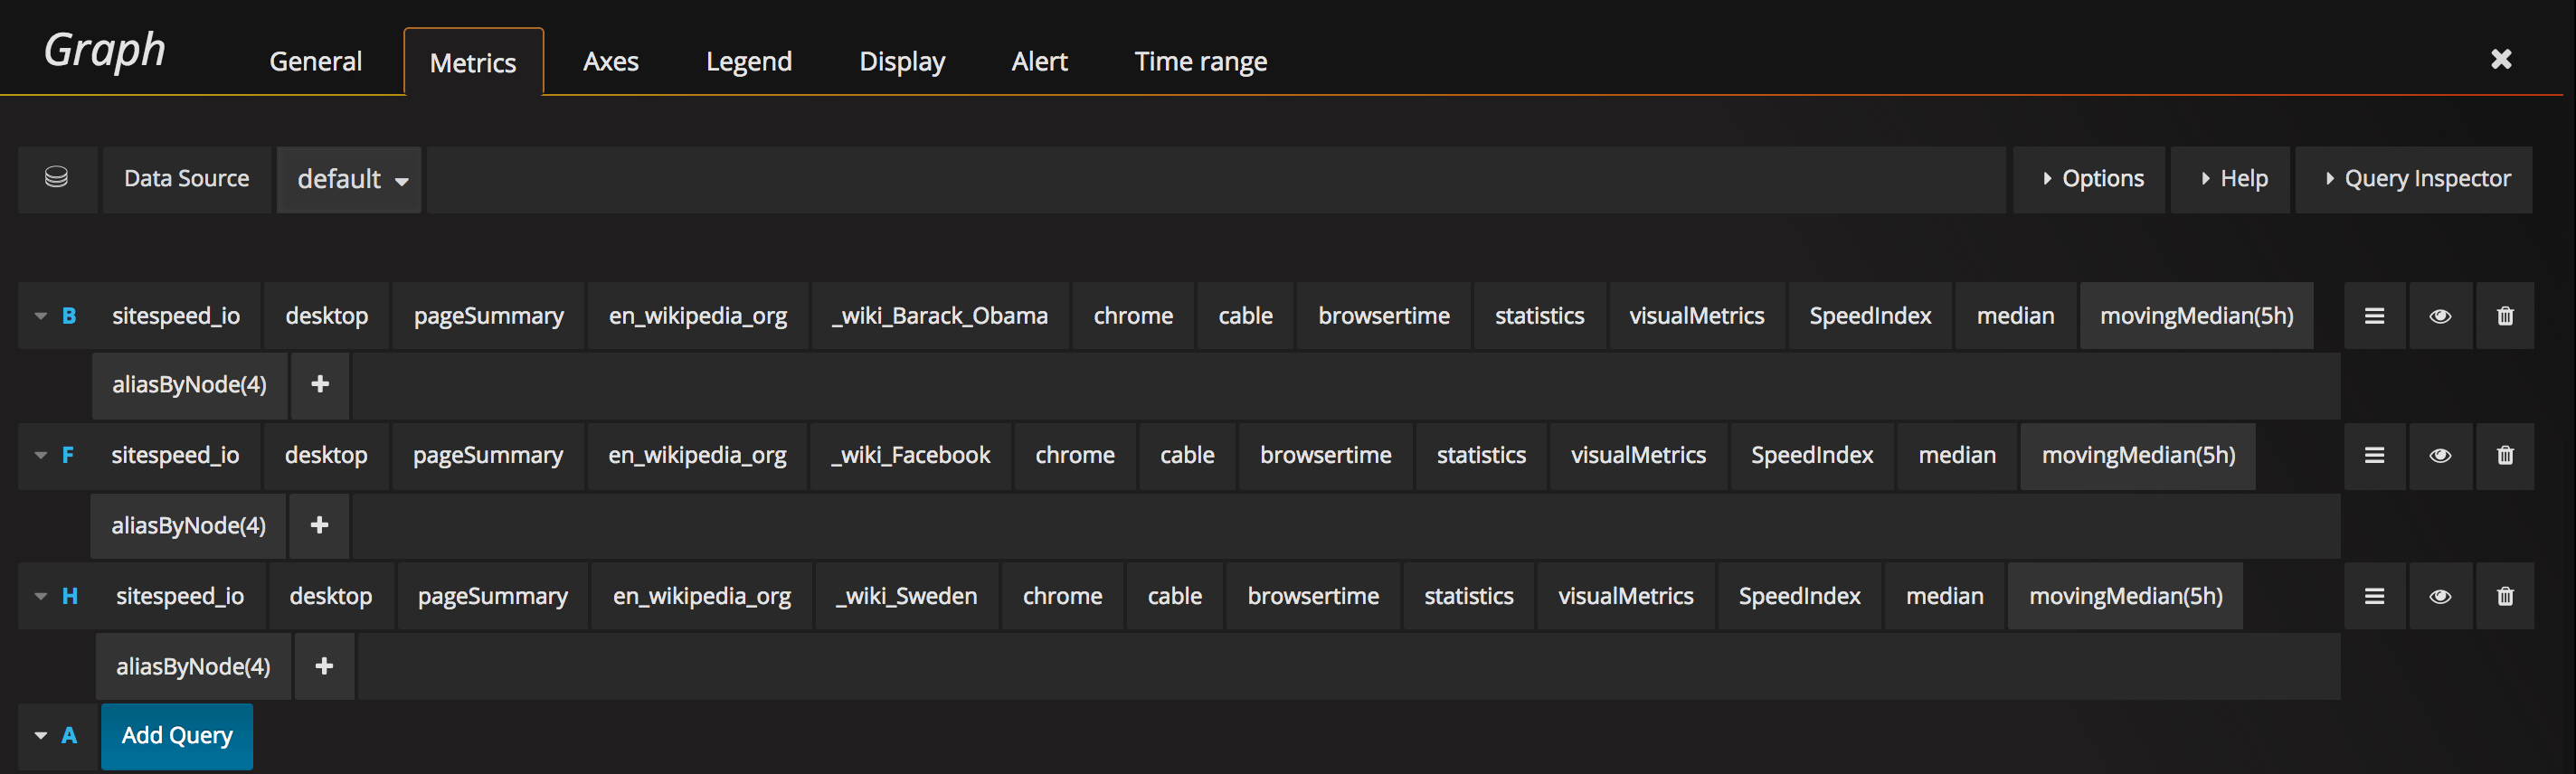
And then we make sure we show the last 7 days. 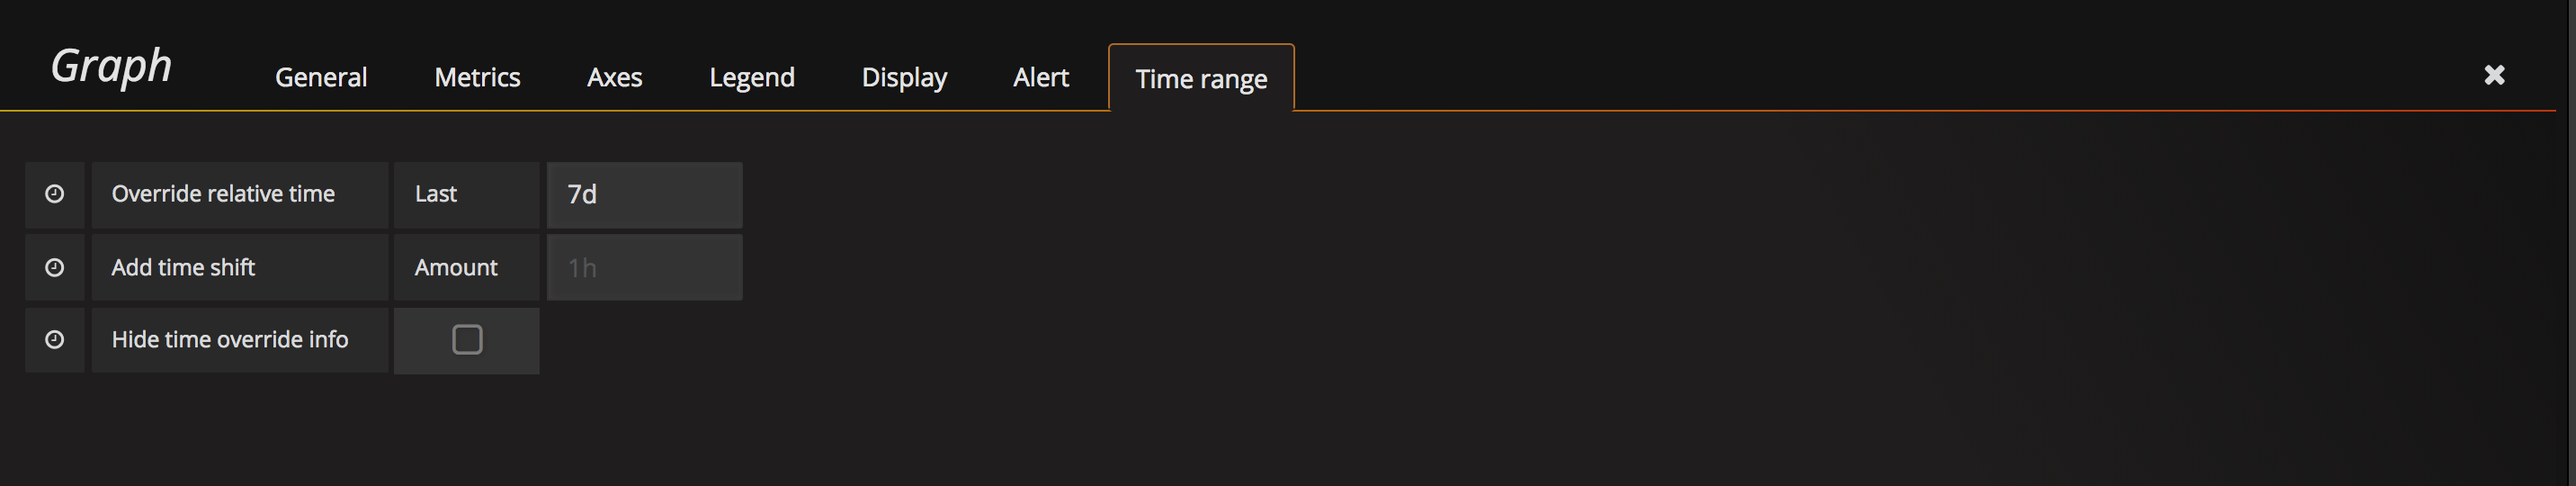
More examples #
Alert on response size #
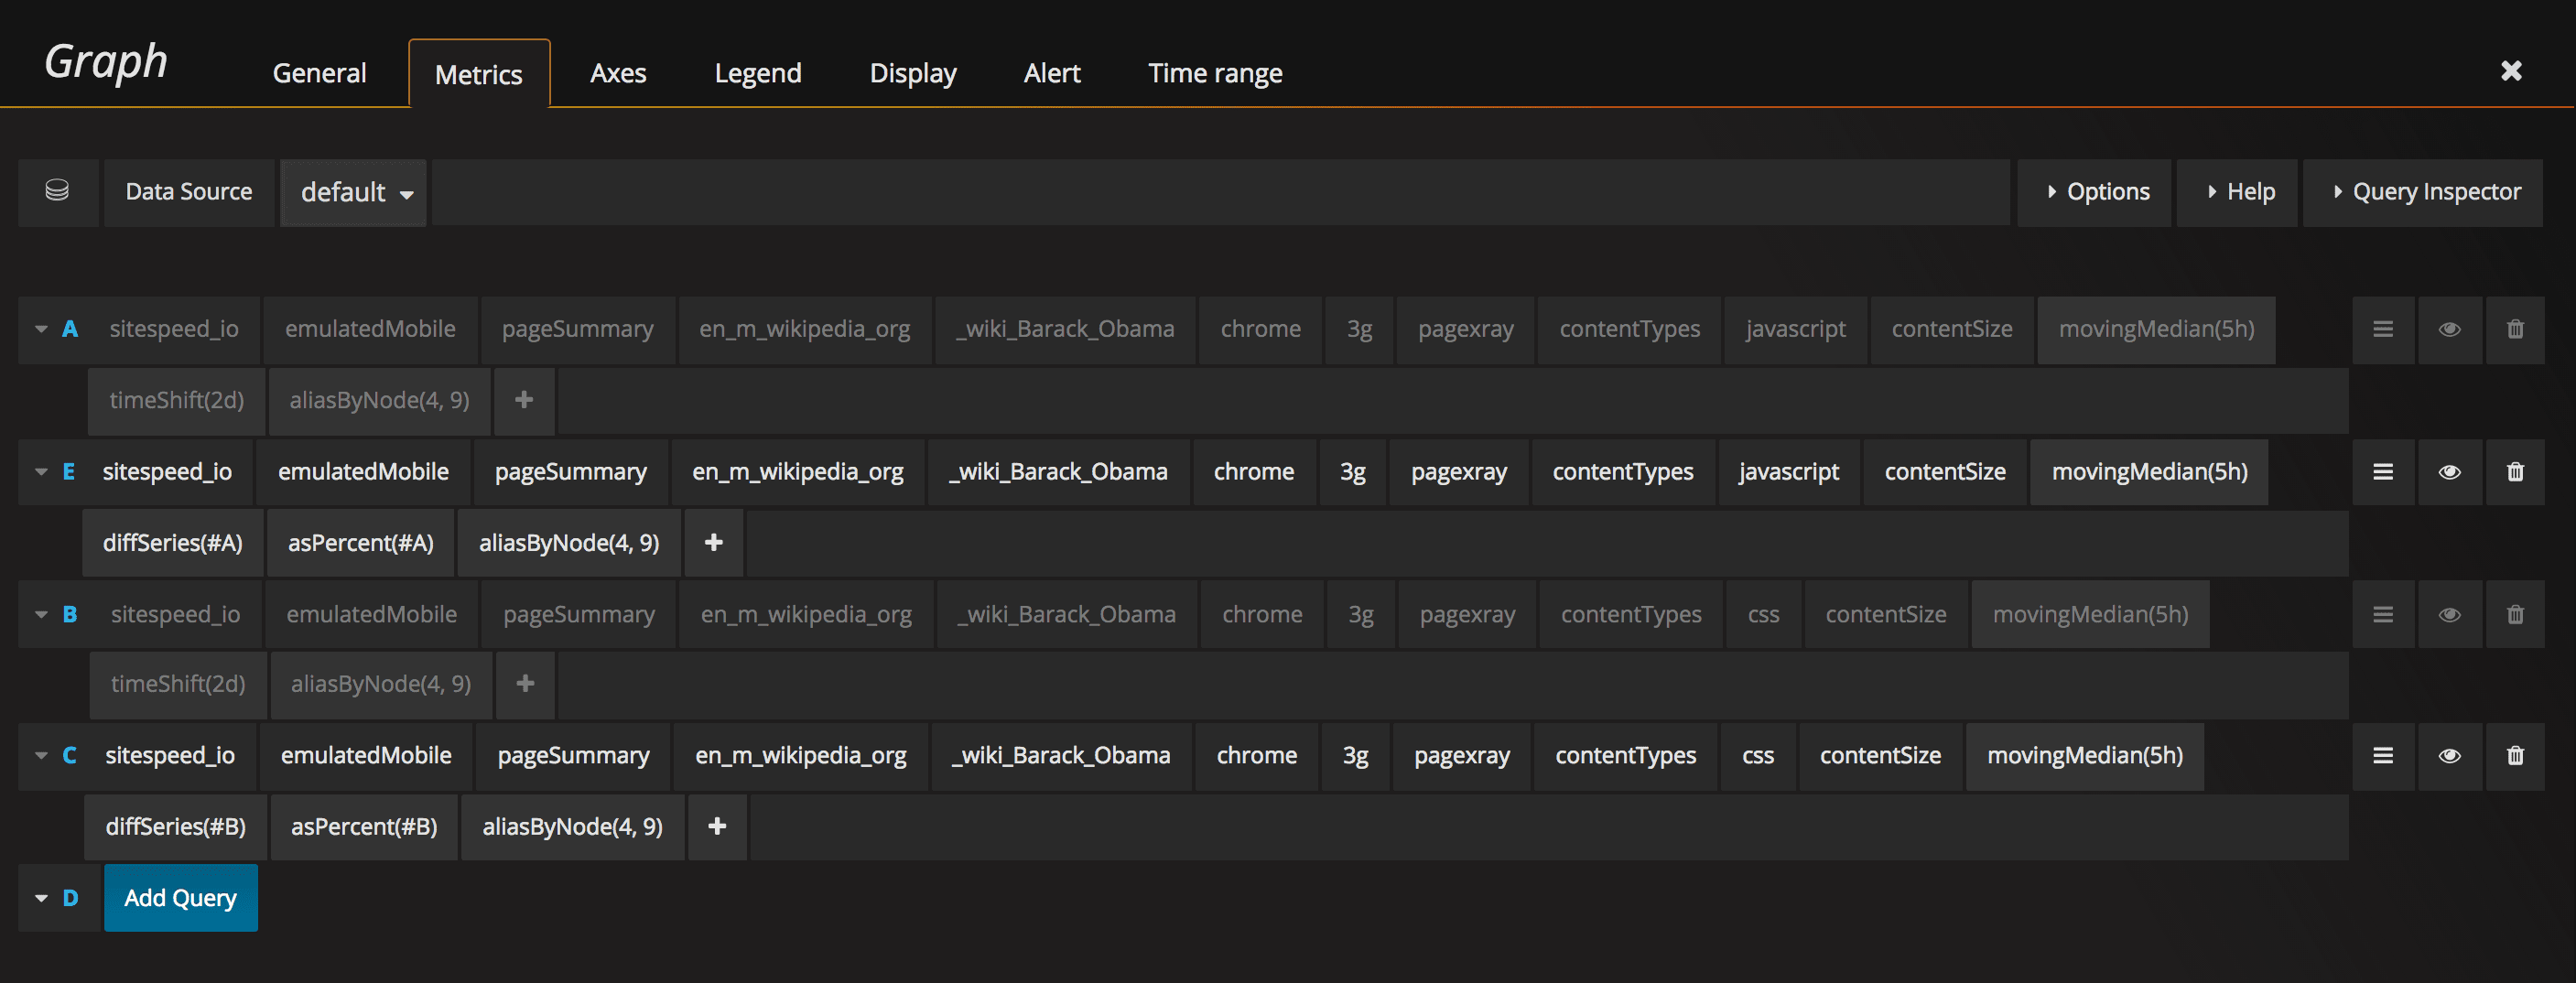
You can also create alerts that alerts when a response types size increase. Here we graph the JavaScript and CSS size.
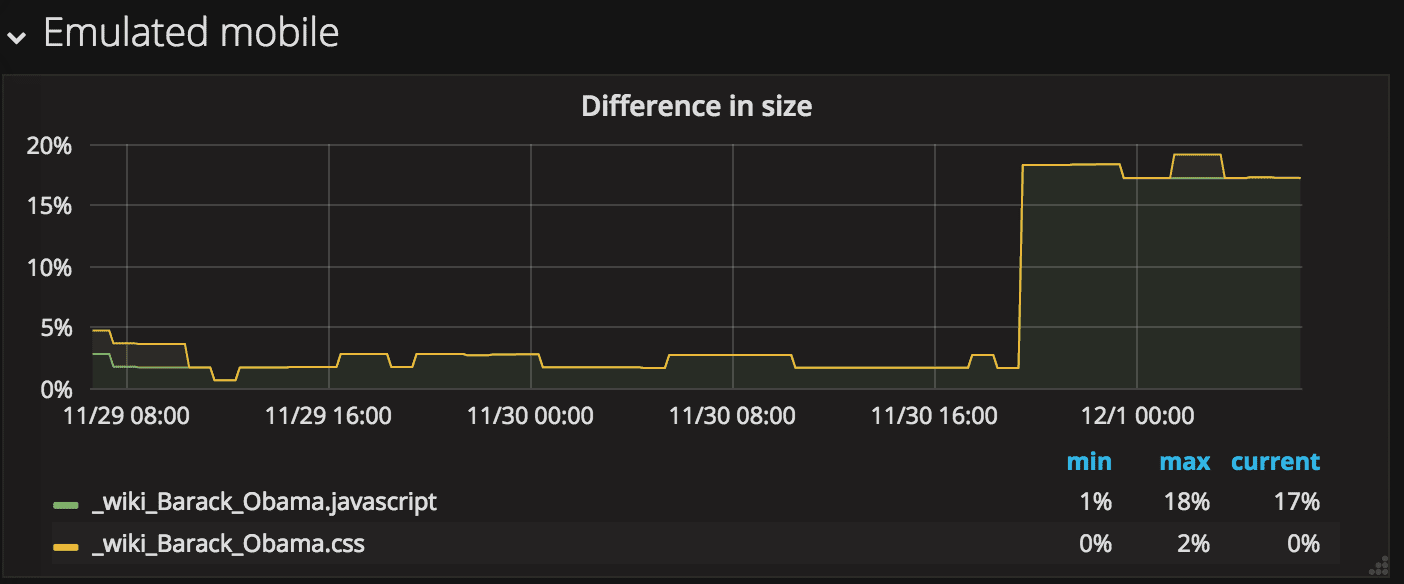
And the queries looks like this:
This is handy if you are not in full control of all the code that is pushed.
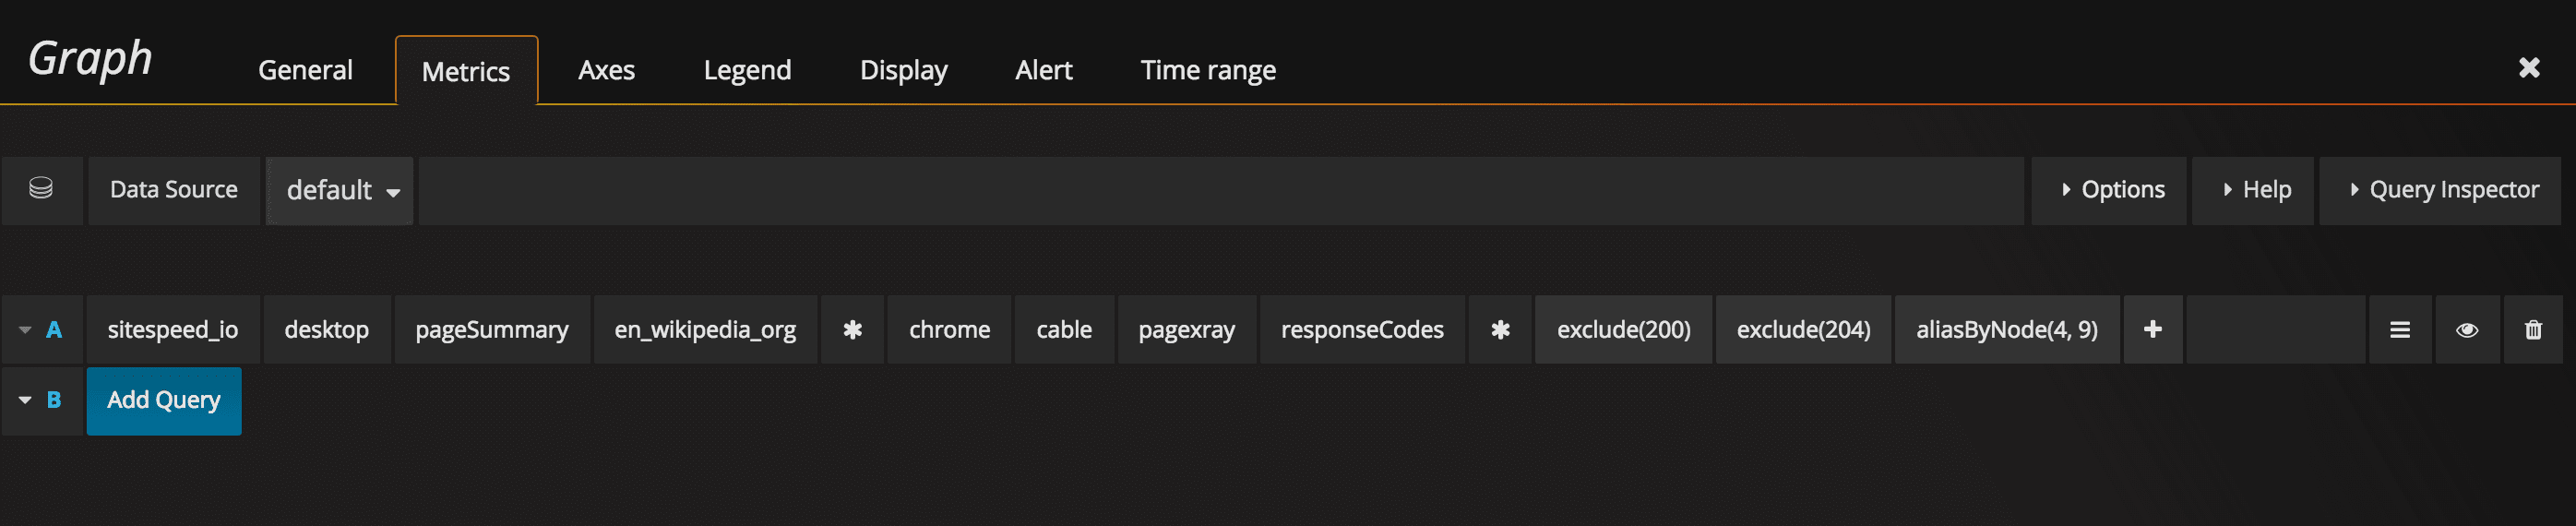
Alert on 404 #
We know it shouldn’t happen but sometimes your page reference a 404 or a 50x. Let us alert on that!
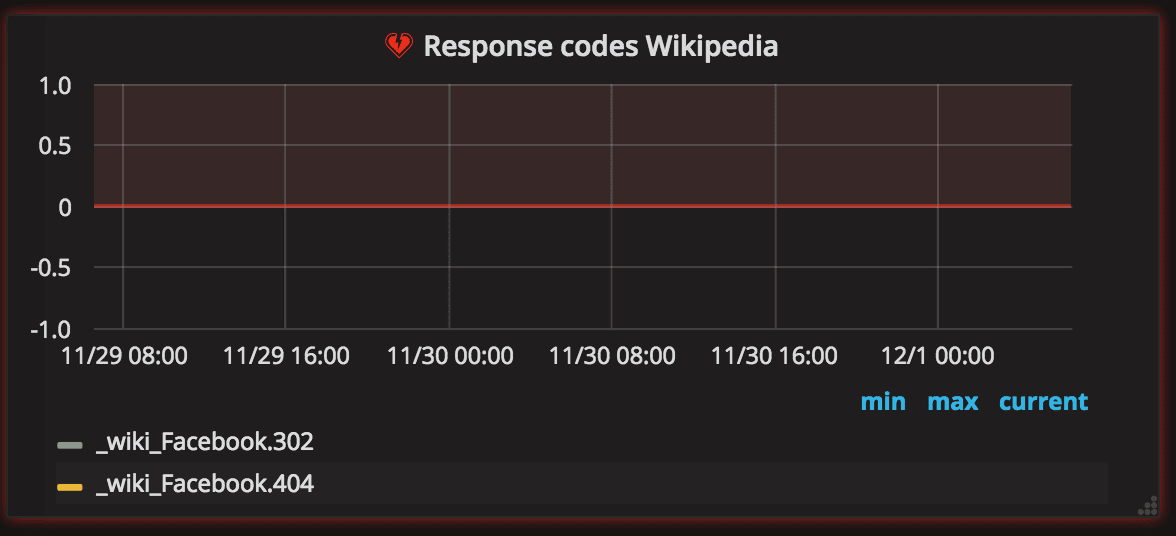
And the query looks like this (modify the excludes so that it matches what you need):
Alert on console.error #
If you use Chrome in your testing you can also collect console log data. And then if you get a JavaScript error on a page you can alert on that.
Setup your query something like this:
And then your actual alert. Make sure to set ‘If no data or all values are null* to No data or Ok so you don’t fire alerts if you don’t get any errors :)
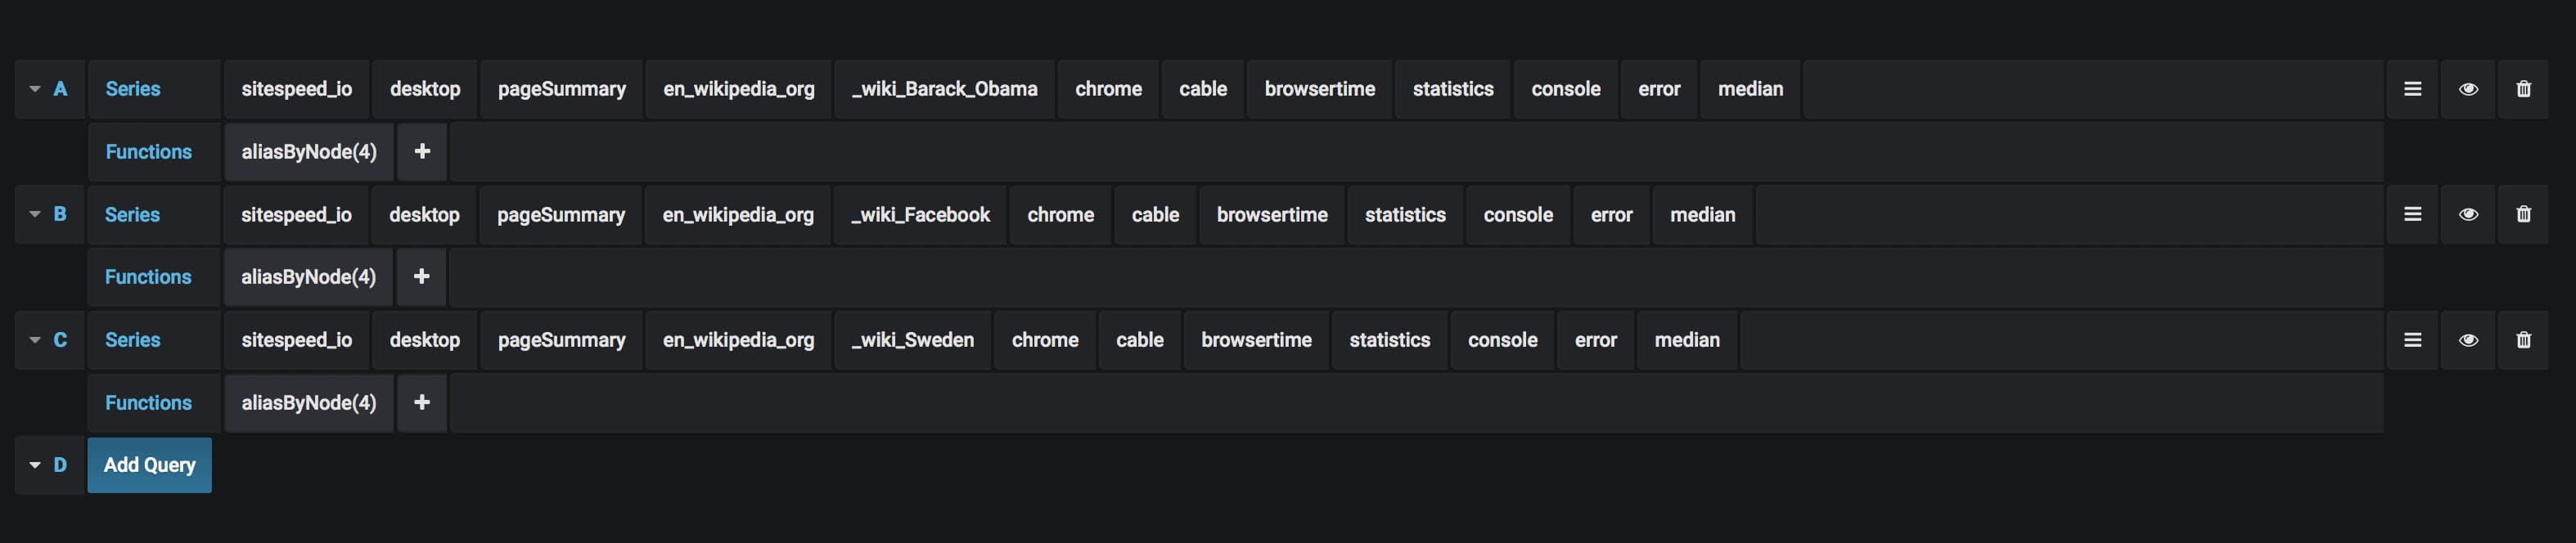
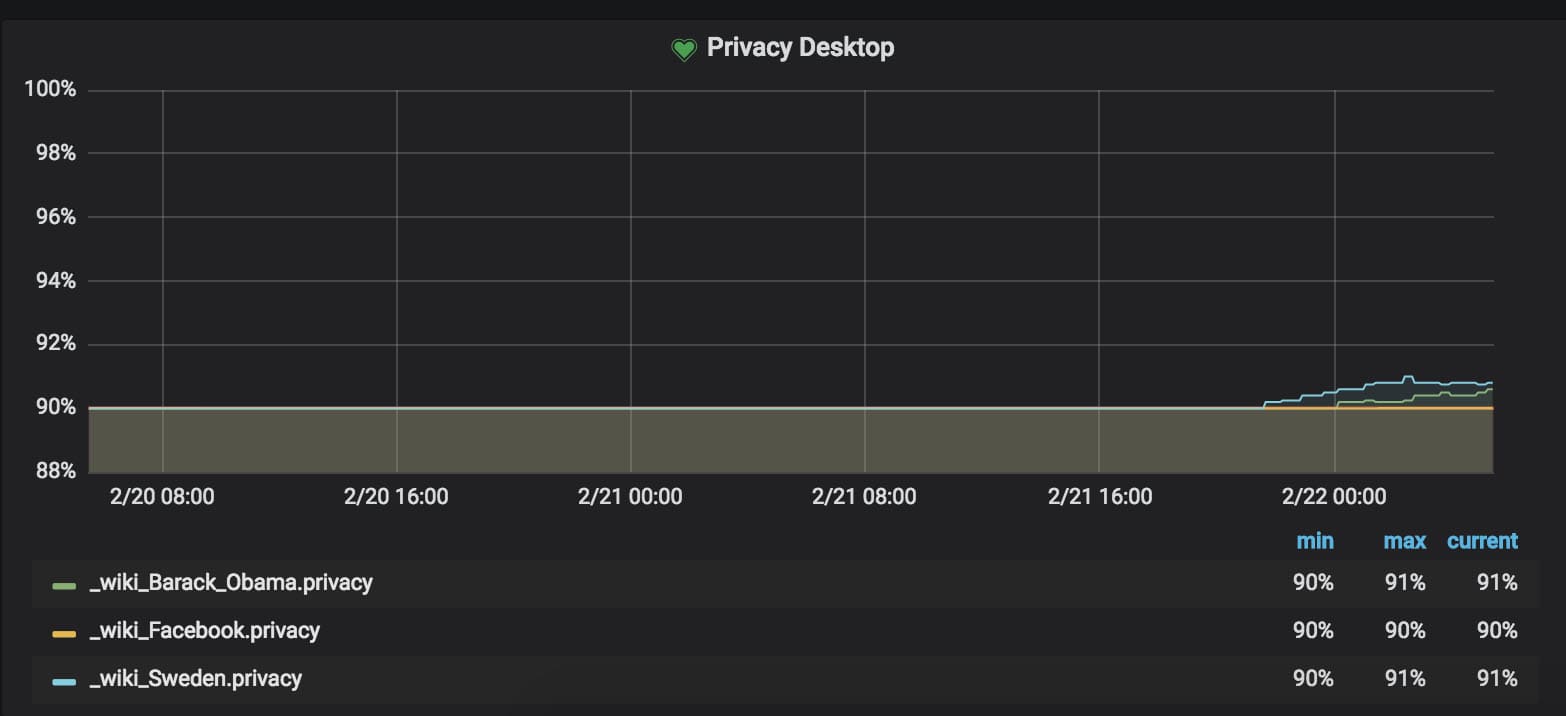
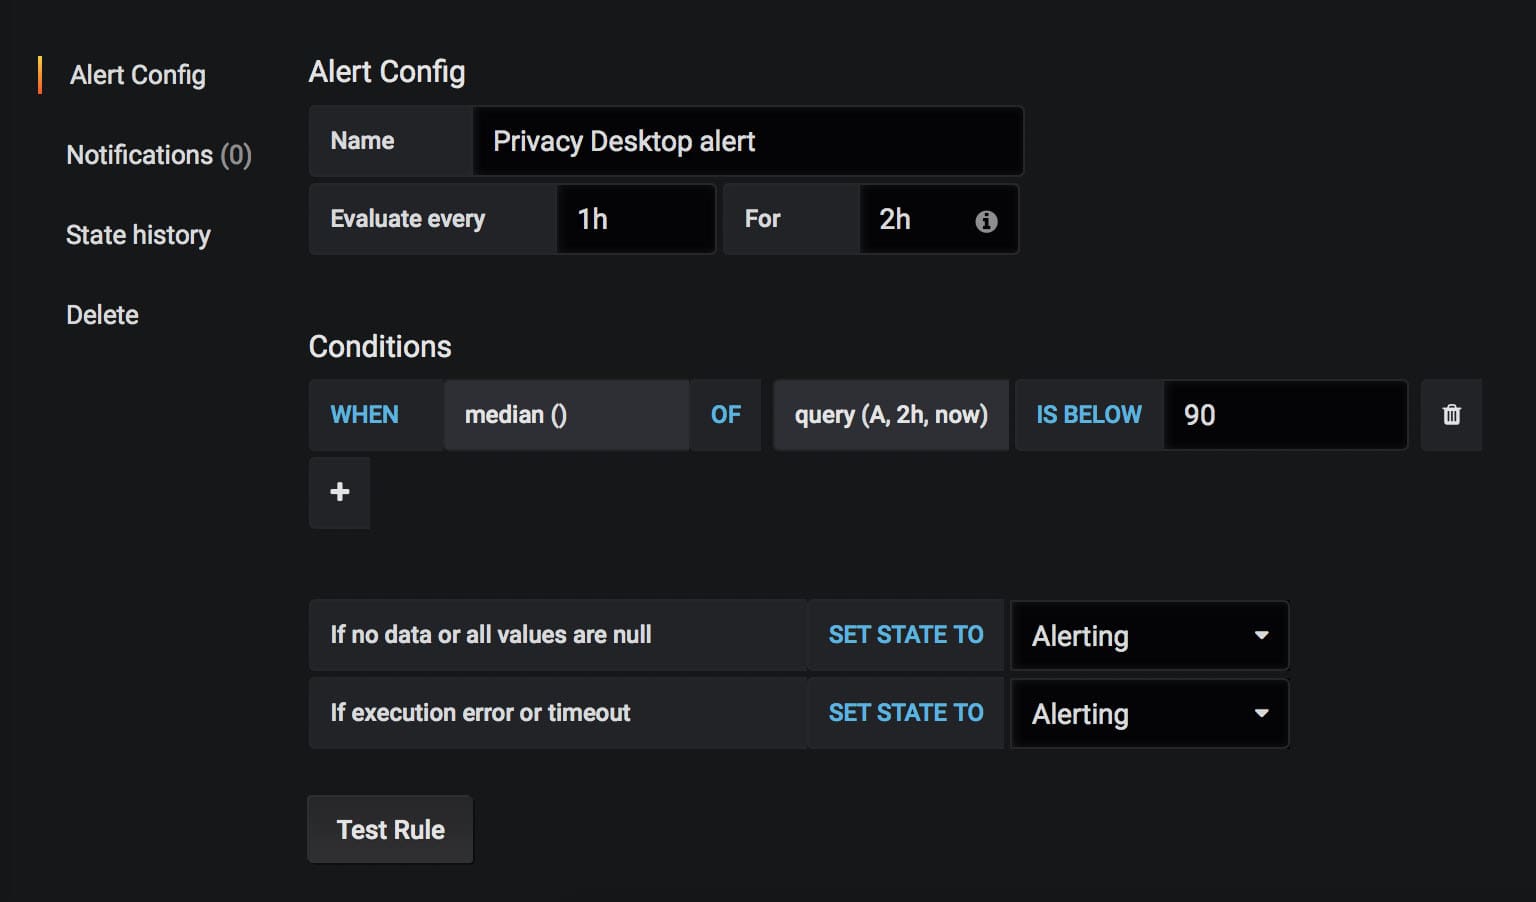
Alert on to low privacy #
One of the most important metrics you can get from the Coach is the privacy metric that helps you see how good you take care of your users and if you share their private information with other companies/web sites.
To get the metric, you query the Coach.
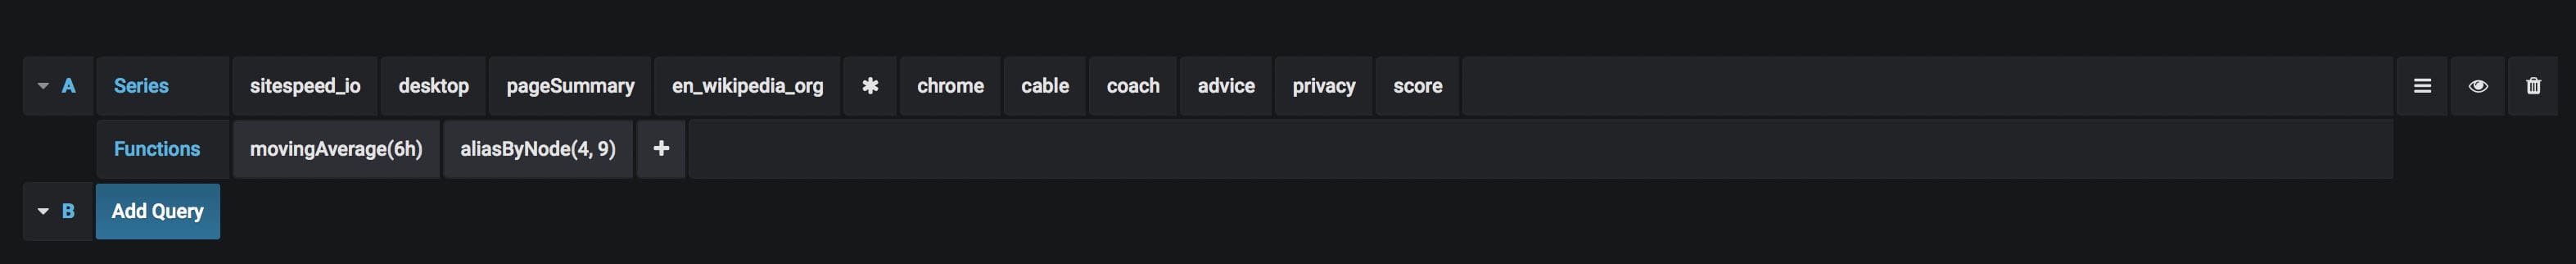
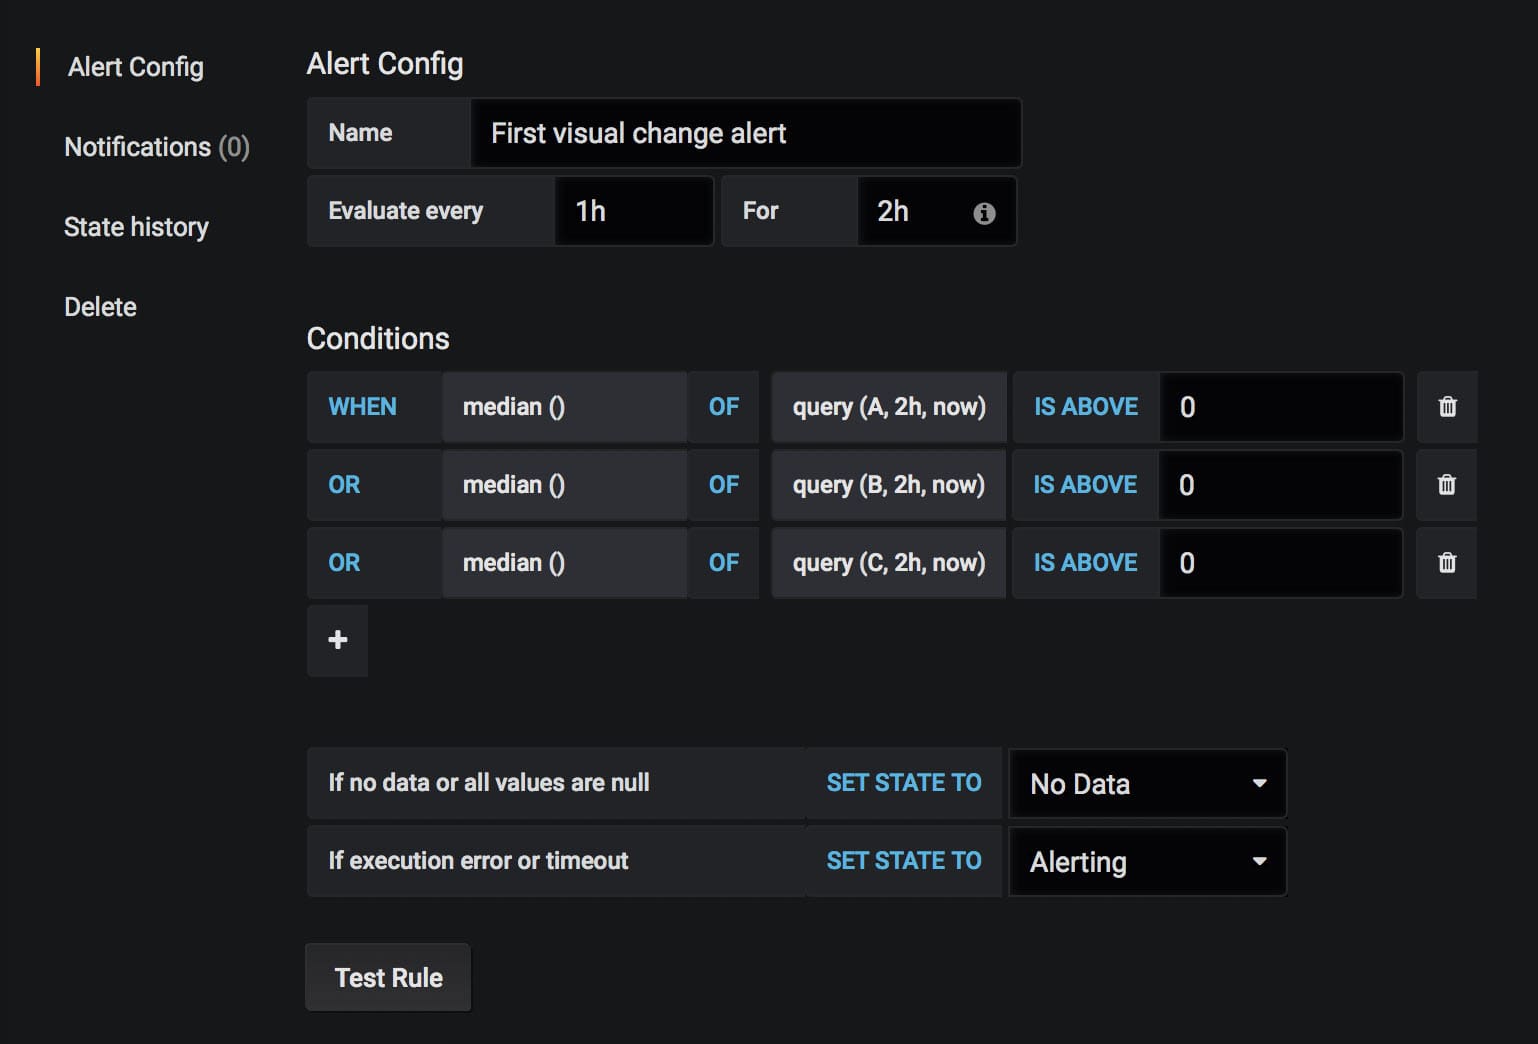
And then when you setup the alert, make sure you alert on values below your current value.
Summary #
You can do the same with all the metrics you want. On mobile Wikipedia metrics is more stable and the First Visual Change looks like this:
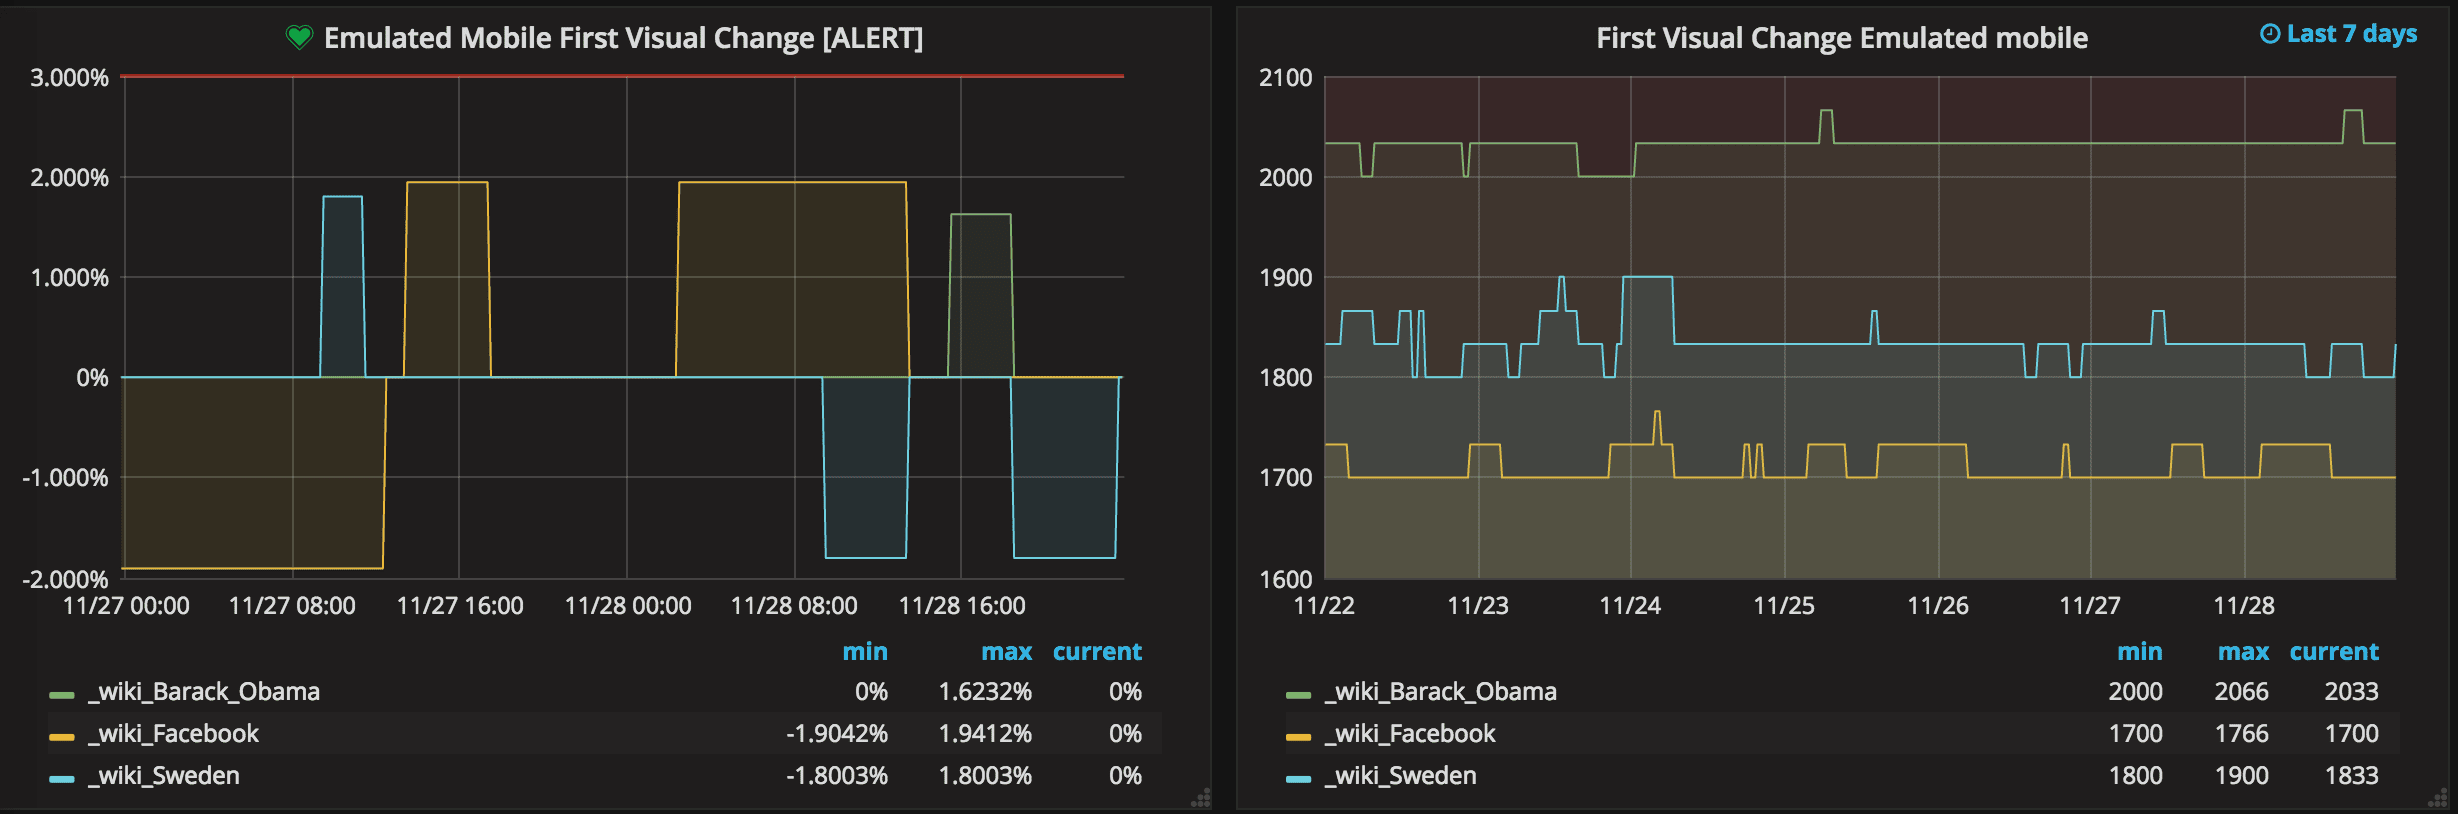
If you have any questions about the alerts, feel free to create an issue at GitHub or hit us on Slack.