Documentation / Compare
Compare - Statistical Methods for Regression Analysis
- Why Mann Whitney U and Wilcoxon for Web Performance?
- Prerequisites
- Save the baseline (save the world)
- Run your test
- Results
- Alert on data in Graphite
Sitespeed.io utilizes Mann Whitney U and Wilcoxon tests for detecting performance regressions.
Why Mann Whitney U and Wilcoxon for Web Performance? #
- Non-Parametric Nature: Both tests are non-parametric, making them ideal for web performance data, which often doesn’t follow a normal distribution. This means they can reliably analyze data with outliers or skewed distributions, common in web performance metrics. Sensitive to Subtle Changes: The Mann Whitney U test, used for comparing two independent samples, and the Wilcoxon test, suitable for paired data, are sensitive to even minor shifts in performance. This sensitivity is critical for early detection of regressions that might not significantly impact average values but could affect user experience.
- Robust Against Variability: Web performance metrics can be highly variable due to factors like network conditions, user behavior, and server load. These tests effectively handle this variability, providing a more accurate reflection of the true performance impact of changes.
- Clarity in Comparative Analysis: Unlike simple average-based comparisons, these tests give a clearer picture of whether the observed performance differences are statistically significant. This clarity is essential for making informed decisions about optimizations and rollbacks.
- Actionable Insights: By identifying statistically significant performance regressions, these tests provide actionable insights. They help in pinpointing specific changes that need attention, enabling targeted optimizations.
Utilizing these tests through the compare plugin allows for a sophisticated approach to web performance analysis. For instance, after deploying a new feature or update, you can compare the new performance data against a baseline using these tests. If the tests indicate a significant performance drop, it’s a strong signal that the recent changes have negatively impacted the site’s speed.
Looking at medians can make it hard to see small changes. This is an example where we look at first visual change for the Barack Obama page. You can see that the metrics goes up at one point but then sometimes it comes back. 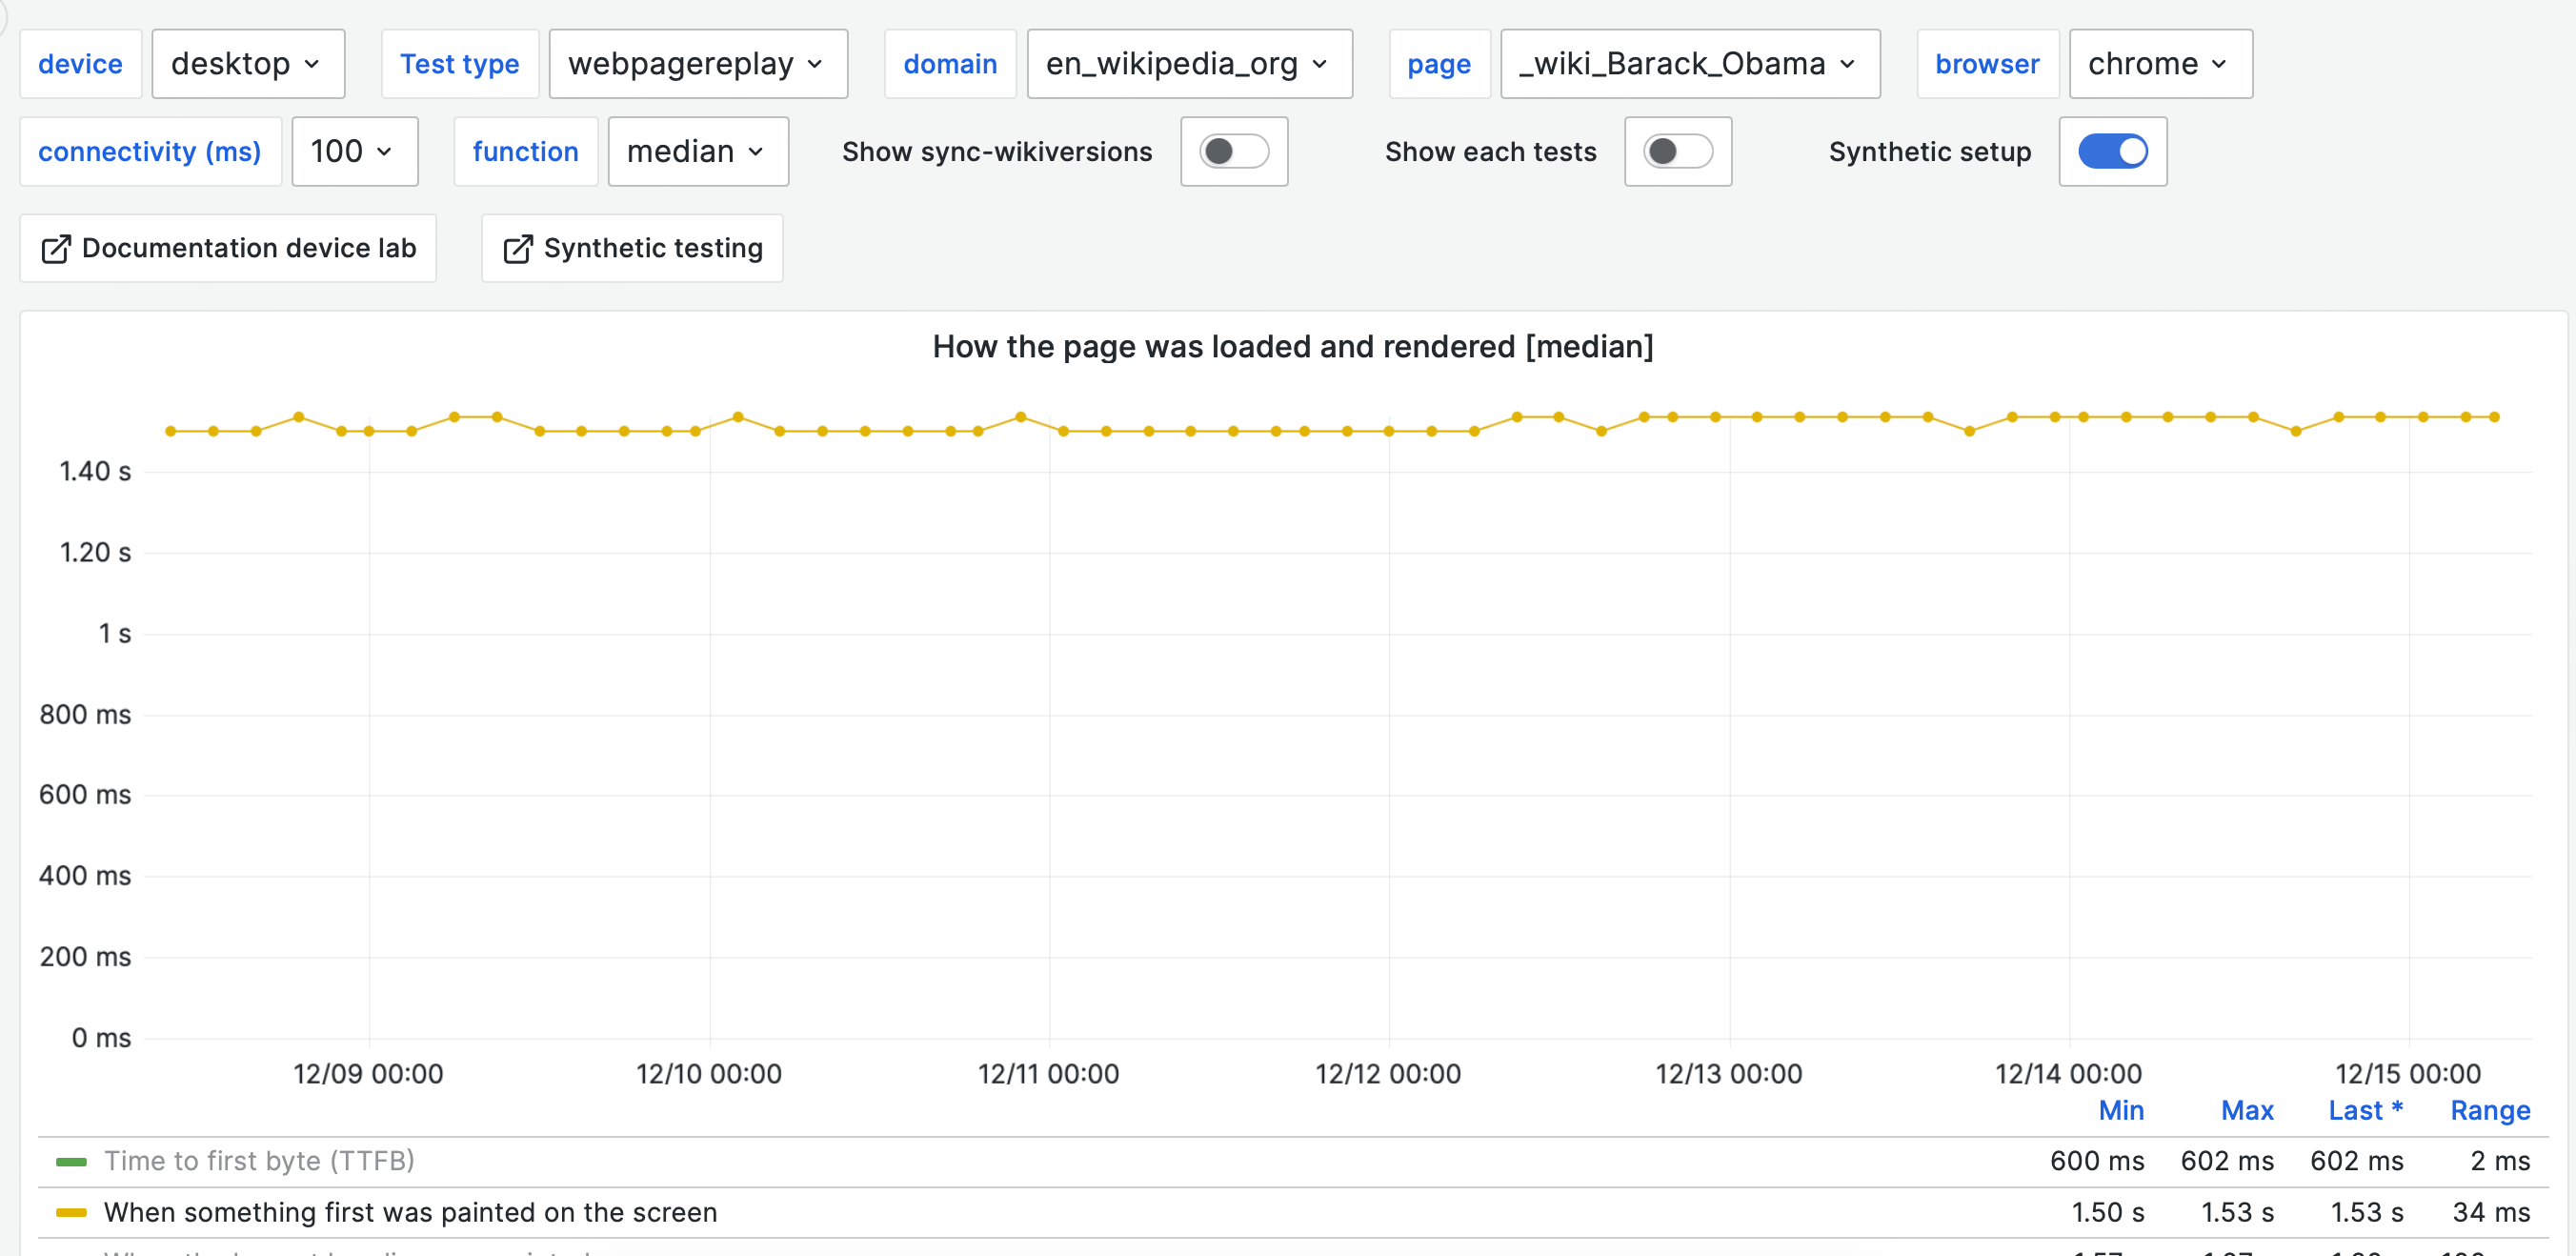
Looking for a signifacnt change help, this is the graph for the same metric when the change occured. 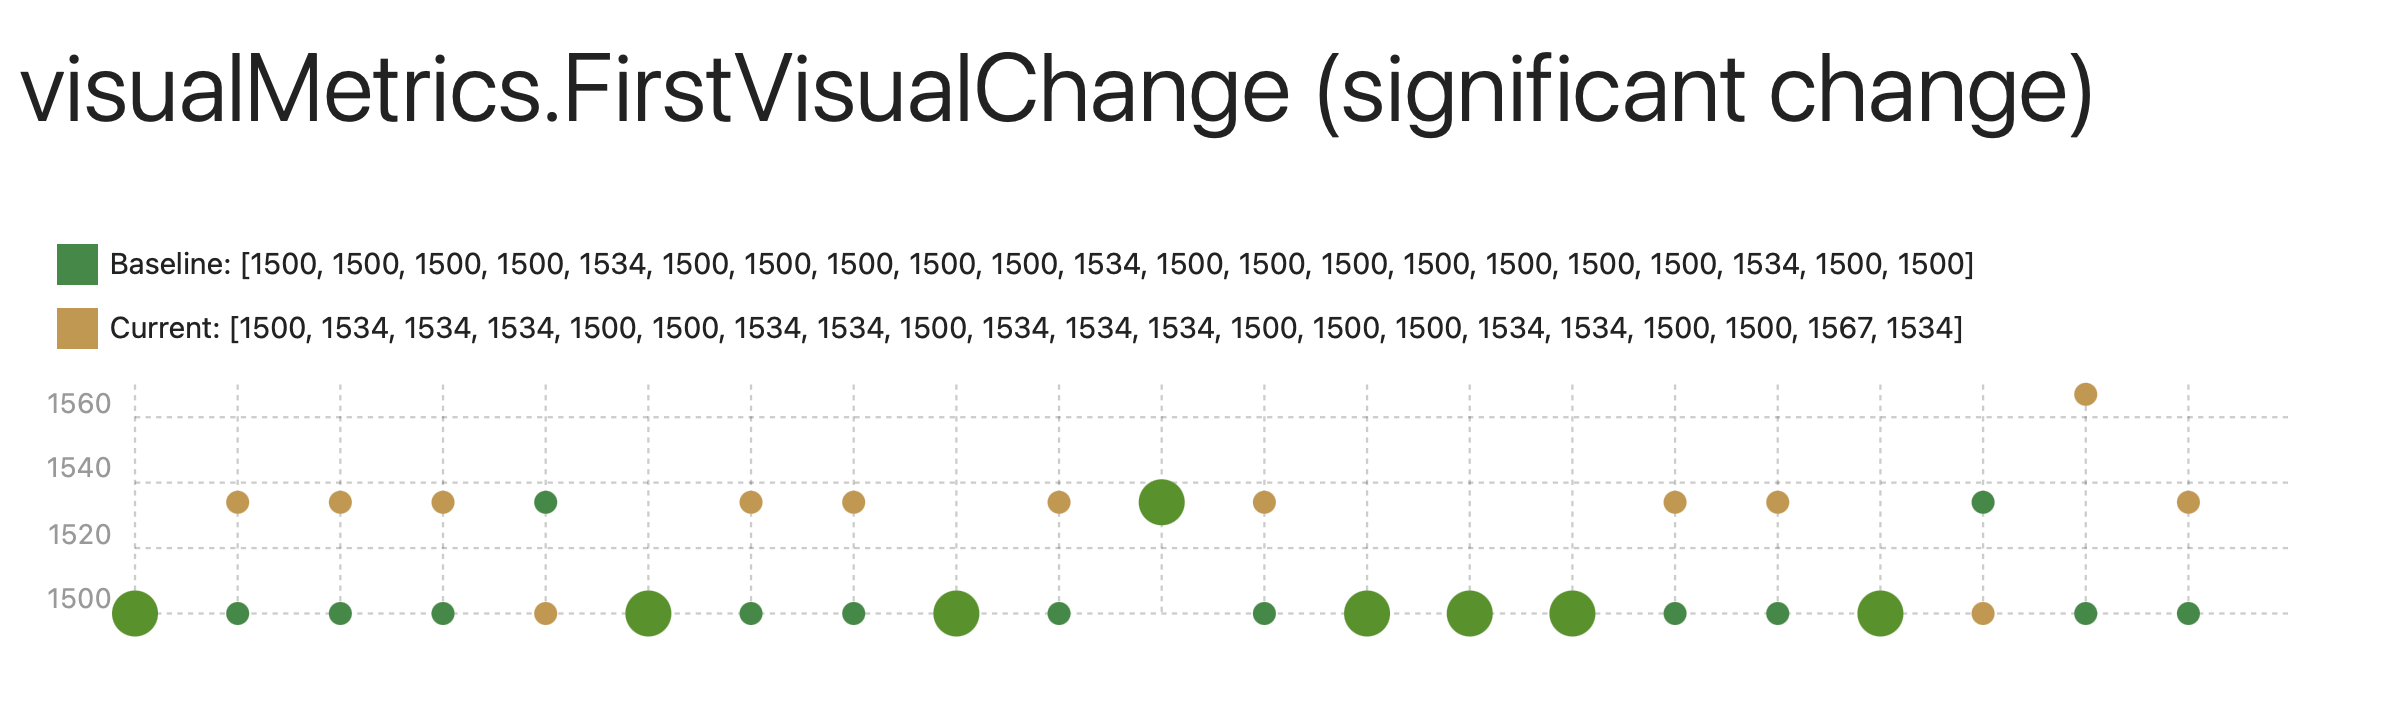
Prerequisites #
To get the compare plugin to work, you need to have Python installed and the scipy library in Python. The easiest way to install that is with pip: python -m pip install scipy. If you use our Docker containers this is already installed.
Save the baseline (save the world) #
By default tests run against a baseline test and look for regressions in the new test. That means that for your test to work you need to collect a baseline. You do that by adding --compare.saveBaseline to your test. And you also need to give your test an unique id. You do that by adding --compare.id myId. Adding those to your test will store the baseline on disk. By default that file is stored in your current directory. You can also change that by adding --compare.baselinePath to set the path to the file. That is useful in Docker if you want the file to be stores outside the container.
To save a baseline using NodeJS:
sitespeed.io https://www.sitespeed.io -n 21 --compare.saveBaseline --compare.id start_page
Using Docker there’s a new volume that you should use to mount where you want to save the baseline. -v "$(pwd):/baseline" will map your current directory to where you will store the baseline files. If you want to store them somewhere else then change what you map inside the container -v "/somewhere/else:/baseline"
docker run -v "$(pwd):/baseline" sitespeedio/sitespeed.io:33.6.0 https://www.sitespeed.io/ -n 21 --compare.saveBaseline --compare.id start_page --compare.baselinePath /baseline
The baseline file is a JSON file that contains all the raw data from Browsertime.
Run your test #
For your test to work, assign the same identification (id) to both your current test and the baseline test. This matching id is crucial for the test to correctly locate and compare with the baseline. Additionally, ensure that the number of iterations in your test matches that of the baseline. Remember, using a sufficiently large number of iterations is essential as it leads to more accurate and reliable results.
sitespeed.io https://www.sitespeed.io -n 21 ---compare.id start_page
In Docker:
docker run -v "$(pwd):/baseline" sitespeedio/sitespeed.io:33.6.0 https://www.sitespeed.io/ -n 21 --compare.id start_page --compare.baselinePath /baseline
You can also save a baseline for each and every test, so you always compare your last run with the run before that. That will automatically happen if you have the --compare.saveBaseline.
docker run -v "$(pwd):/baseline" sitespeedio/sitespeed.io:33.6.0 https://www.sitespeed.io/ -n 21 --compare.id start_page --compare.baselinePath /baseline --compare.saveBaseline
Results #
When you run your test, it will create a new tab in the HTML results. This tab will include a results table that shows various result data and comparison graphs that for each metric, shows graphs comparing the baseline (previous data) with the latest run.
The result table looks something like this:
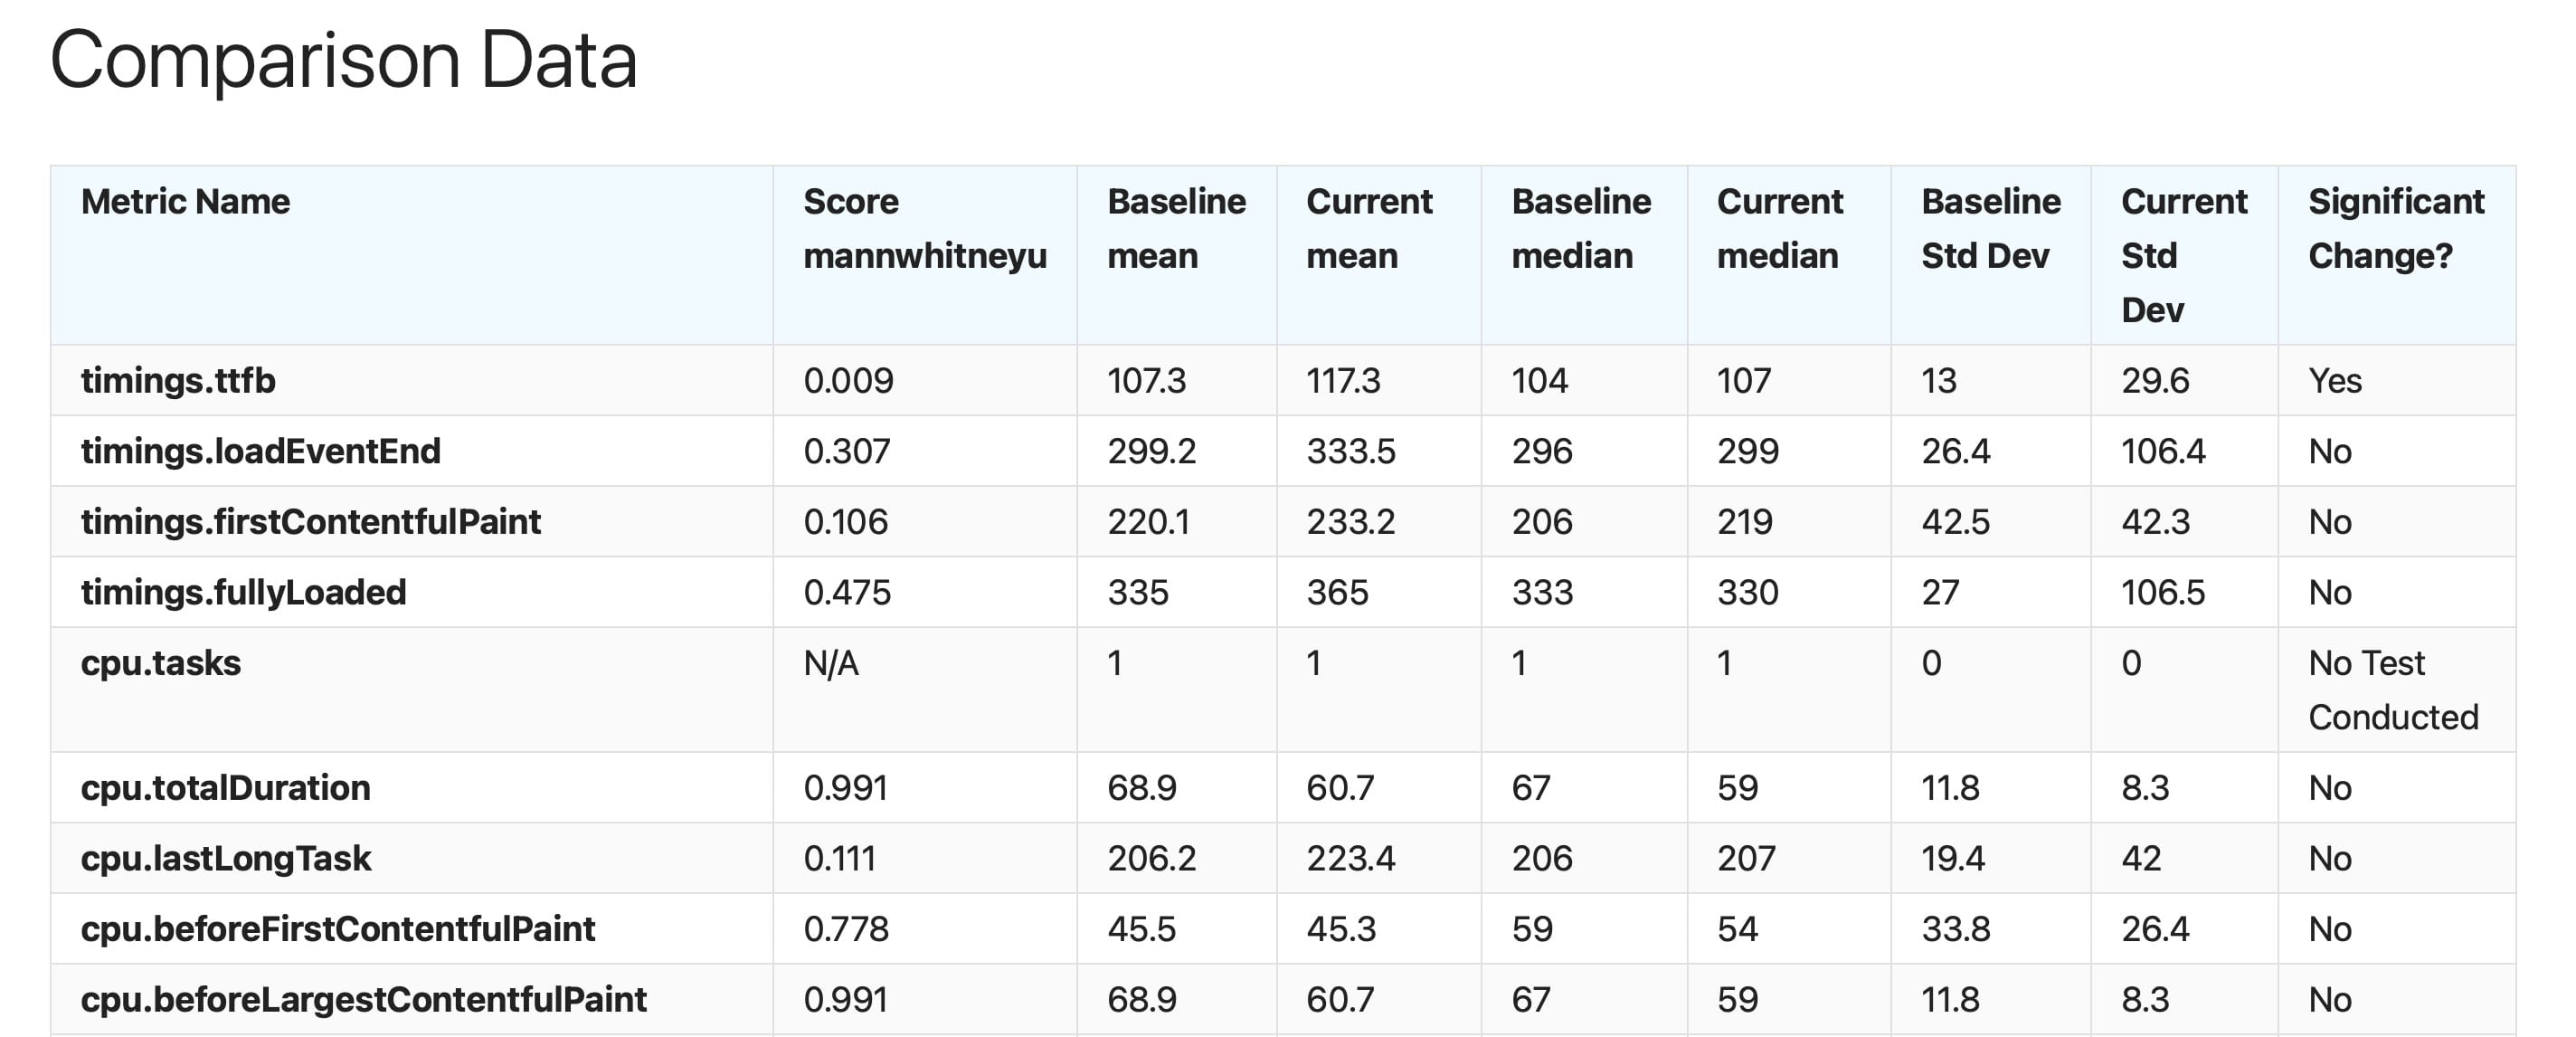
The columns:
- Metric Name: This column lists the names of the performance metrics that were tested. These could be timings for different events (like Time to First Byte, load event completion, first contentful paint, etc.), or CPU-related metrics (like total duration of CPU tasks, duration of the last long task, etc.).
- Score (mannwhitneyu/wilcox): This column shows the Mann-Whitney U/Wilcox scores for the comparisons between baseline and current test runs for each metric. A lower score typically indicates more significant differences between the two groups being compared.
- Baseline Mean: The average (mean) value for the baseline test run for each metric.
- Current Mean: The average (mean) value for the current test run for each metric.
- Baseline Median: The median value for the baseline test run for each metric. The median is the middle value when all the results are ordered from lowest to highest.
- Current Median: The median value for the current test run for each metric.
- Baseline Std Dev: Standard deviation for the baseline test run for each metric. This measures the amount of variation from the average.
- Current Std Dev: Standard deviation for the current test run for each metric.
- Significant Change?: This column indicates whether the change between the baseline and current test runs is statistically significant for each metric. If the change is statistically significant then we use Cliffs Delta to know if the change is small, medium or large.
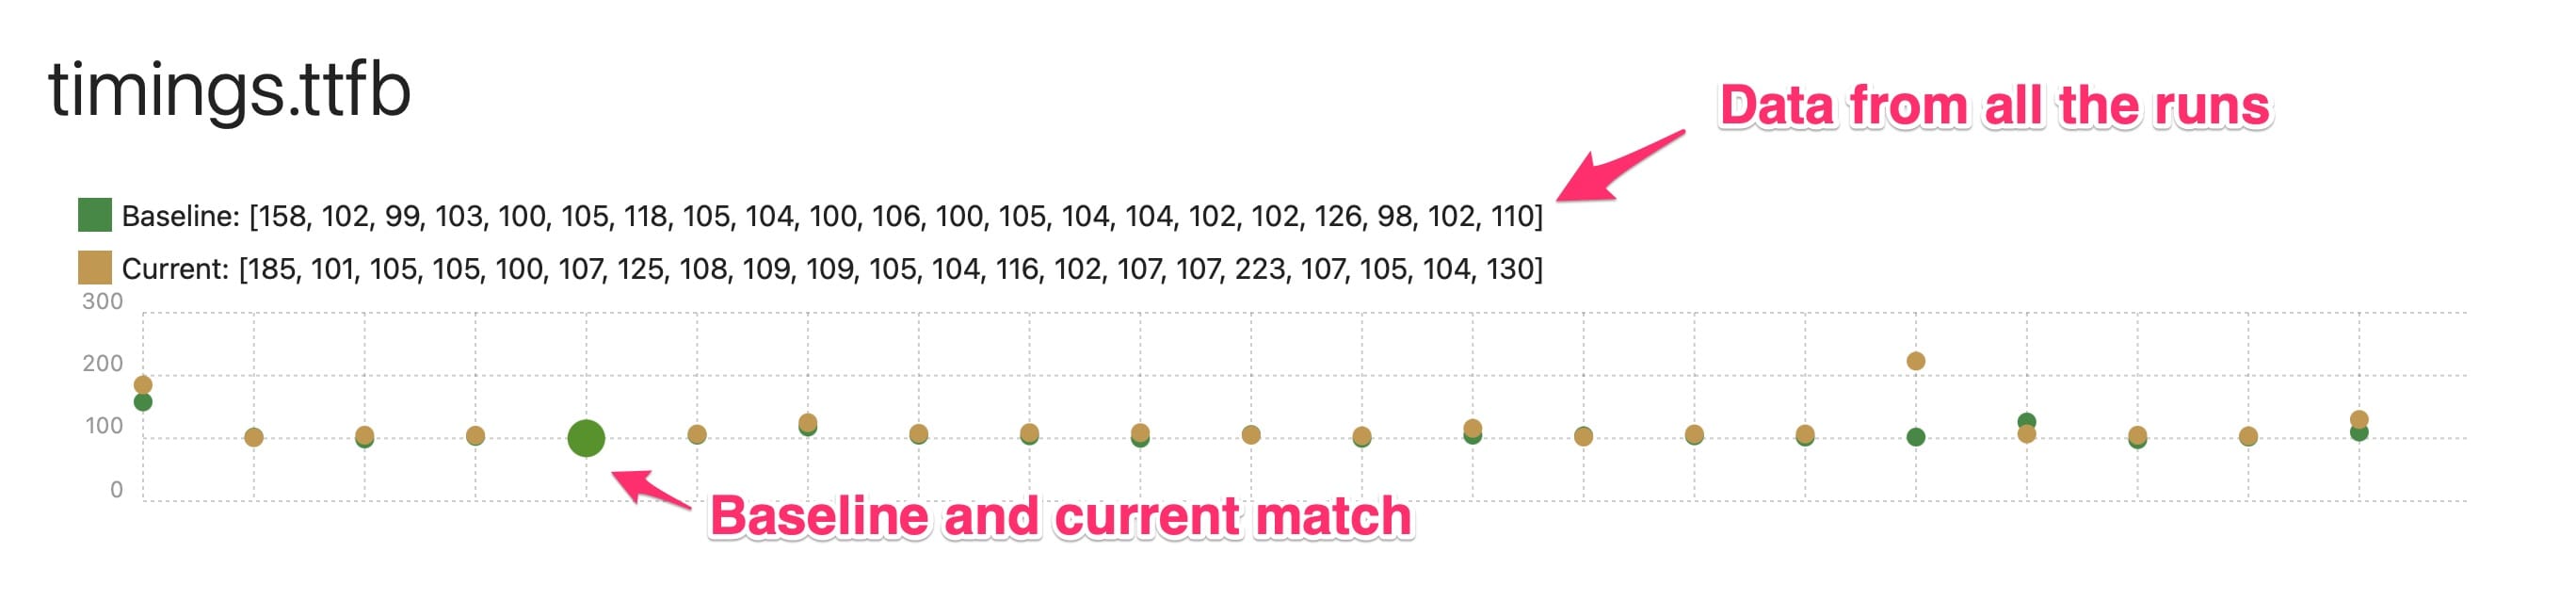
And the compare graphs will look like this for every metric:
Understanding Significant Changes #
In the results table, you’ll see a list of all metrics with their corresponding scores.
If a score is below 0.05, it indicates a statistically significant difference between the baseline and the current data. By default we test if the current data is greater than the baseline. You can change that using --compare.alternative. You can test if it’s smaller or if there are any difference between the two (‘two-sided’).
If the score is below 0.05, it means that the changes observed in the metric are likely not due to chance.
What does ‘No Test Conducted’ Mean? #
If you see a result marked as no test conducted, it means the analysis couldn’t be done. This usually happens when the data samples are too similar or don’t show enough variation to conduct a meaningful analysis.
Alert on data in Graphite #
The actual score is automatically sent to Graphite for each metric, which makes it possible to create alert rules in Grafana to alert on regressions. Documentation on how to do that will come soon.